The CB360 Composite National Ranking (CNR) – a statistical formula created in 2009 and enhanced over the years by CollegeBaseball360 founder Pete LaFleur – are back for a 10th season in 2018, with the usual mixture of traditional powers and upstart programs scattered through the preseason top-50.
>> CLICK HERE for CB360 Top–50 Opening Week Scoreboard (to be updated all weekend)
The defending College World Series champion Florida Gators are the clear No. 1 in CB360’s 2018 preseason Composite National Rankings, totaling 97.79 out of the maximum 100 points to place nearly a full point ahead of No. 2 Oregon State (96.94). The Gators also recently were the CNR preseason #1 in both 2012 and ’16. Texas Tech is a distant third in the 2018 preseason CNR (94.74), followed by Florida State and TCU to round out the top-5. The balance of the top-10 (6th-10th) includes: North Carolina, Arkansas, Kentucky, LSU and Louisville.
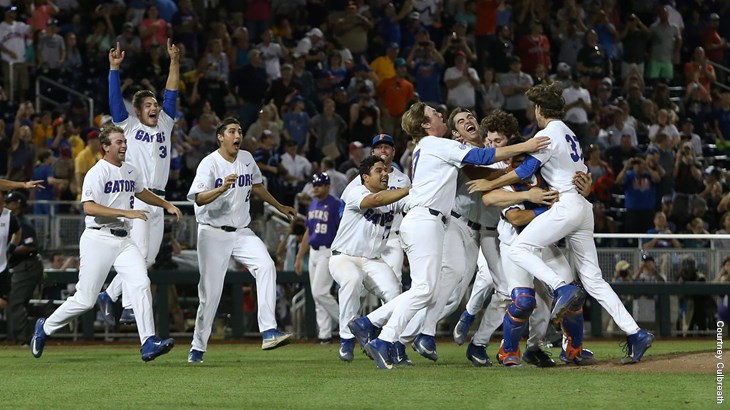
The defending national champion Florida Gators – who return many key members of the 2017 College World Series team – will enter 2018 atop CB360’s exclusive Composite National Rankings (a familiar #1 position for the Gators over the past few years). > photo courtesy Florida
____
(Scroll down for the full CNR preseason top-50, plus plenty of historical notes, some photos of 2018 teams/players and archived CNR preseason/final polls from 2011-17 … note that some additional photos may be added to this release … the customary CB360 Top-50 Opening Week Scoreboard also will be posted online and cross-linked here on this release).
Four of the top-10 spots are occupied by Southeastern Conference teams, plus three Atlantic Coast Conference teams, two from the Big 12 and the Pac-12’s Oregon State.
Florida has been No. 1 (’16 & ’18) or No. 2 (’17) in each of the past three years of the CNR preseason top-50 (also was #4 preseason in 2015). The Gators also own the most CWS appearances (5; in 2011, ’12, ’15, ’16 and ‘17) spanning the previous seven seasons (2011–17), including an active streak of three straight trips to Omaha.

Texas Tech – which has made two College World Series appearances over the past four seasons (2014 and ’16) – check in at No. 3 in the 2018 CB360 preseason Composite National Rankings (CNR). This marks the highest preseason ranking for the Red Raiders in the nine-year history of the CNR (and likely TTU’s highest CNR ranking at any time during a season). > photo courtesy Texas Tech
____
Expanding out to the preseason CNR top-16 (i.e. potential NCAA Regional No. 1 seeds/likely hosts), there are six SEC teams (add #12 Vanderbilt and #13 Texas A&M), along with four total from the ACC (adding #16 Virginia). Stanford and UCLA, at #11 and #14 respectively, give the Pac-12 three team in the top-16, while the Big West’s Cal State Fullerton (#15) rounds out the preseason top-16 contingent (including the two Big 12 in the top-10).
>> Note that plenty of in-depth details are included below (including a full listing of the top-50) … but here’s a quick rundown of the balance of the top-50: [17] Texas, [18] Clemson, [19] Miss. St., [20] Ole Miss, [21] So. Miss., [22] So. Ala., [23] Houston, [24] NC St., [25] Ariz., [26] S.C., [27] Dallas Baptist, [28] Miami, [29] Mo. St., [30] Sam Houston, [31] LB St., [32] UCF, [33] WVU, [34] ULL, [35] Ind., [36] Auburn, [37] OK St., [38] USD, [39] Wake, [40] Oka., [41] Mich., [42] Ga. Tech, [43] St. John’s, [44] Neb., [45] BYU, [46] Rice, [47] Duke, [48] Cal, [49] Coastal & [50] San Diego St.
Also, a full conference breakdown of the top-50 is includes further down this release … but for quick reference, the 2018 CNR preseason top-50 includes 10 each from the SEC & ACC, 6 Big 12, 5 Pac-12, 3 Sun Belt, 3 Big Ten, 2 Big West, 2 C-USA, 2 AAC, 2 MVC, 2 WCC and one each from the Southland, Big East & Mt. West.
• OLD RELIABLES – In the nine-year history of the CNR, there have been 18 teams in the preseason top-50 each of those seasons (2010-18):
Florida (avg. preseason rank: 5.9 … #9–2–1–14–19–4–1–2–1 from ’10–‘18)
LSU (7.0 … 2–19–10–4–6–5–5–3–9)
Vanderbilt (8.8 … 31–4–11–3–10–1–2–5–12)
TCU (9.0 … 11–3–13–12–22–3–11–1–5)
Florida State (9.4 … 7–12–12–15–5–13–13–4–4)
CS Fullerton (12.4 … 3–8–19–23–1–16–16–11–15)
North Carolina (12.8 … 13–30–4–2–13–12–23–12–6)
Virginia (12.8 … 4–15–23–29–3–2–7–16–16)
South Carolina (13.6 … 20–9–2–7–12–11–29–6–26)
UCLA (14.4 … 25–1–16–5–11–6–9–43–13)
Louisville (15.0 … 19–27–28–16–14–19–4–7–10)
Texas (16.1 … 1–6–7–24–23–9–25–33–17)
Oregon State (16.3 … 16–44–27–9–2–31–8–8–2)
Miami (18.1 … 14–20–15–26–17–18–6–18–28)
Rice (19.1 … 6–17–6–21–15–14–21–26–46)
Texas A&M (18.7 … 30–14–5–25–25–33–3–20–13)
Georgia Tech (26.8 … 8–23–9–18–35–39–39–28–42)
Ole Miss (28.0 … 22–43–33–22–32–24–31–25–20)
… Florida and LSU have been CNR preseason top-20 every year from 2010-18 (Gators top-10 every year but ’13 and ’14; LSU preseason top-10 all but 2011) … Vanderbilt has been top-12 in the preseason CNR every year since 2011 … with the exception of #22 in 2014, TCU has been 13th or better in eight of the past nine preseason CNRs … FSU has been top-15 preseason CNR every year (2010-18) … Fullerton has been a perennial top-25 preseason CNR team (each of the nine seasons).
>> Beyond the 18 teams highlighted above, there have been five other teams that have been in the CNR preseason top-50 during eight of nine seasons (2010-18):
Arkansas (all but 2017; high of #1 in 2013)
Stanford (all but 2016; high of #3 in 2012)
Clemson (all but 2016; high if #7 in 2011)
Arizona State (all but 2018; high of #10 in 2011 and ’11)
Coastal Carolina (all but 2015; high of #9 in 2017)
>> … and six other teams then have been preseason CNR top-50 in seven of the nine seasons (2010-18):
Mississippi State (all since 2012; high of #4 in 2014)
NC State (all but 2010 and ’15; high of #8 in 2014)
Arizona (all but ’15 and ’16; high of #10 in 2017)
Oklahoma State (all but ’11 and 1’3; high of #7 in 2015)
Oklahoma (all but ’15 and ’17; high of #7 in 2017)
Oregon (all but ’10 and ’18; high of #8 in ’13)
>> in terms of six CNR preseason top-50 appearances from 2010-18, there are six teams in that group:
Kentucky (all but 11-12-17; high of #11 in 2013)
Southern Miss. (all but 14-15-16; high of #21 in 2018)
Dallas Baptist (all but 10-11-14; high of #27 in 2018)
San Diego (all but 12-16-17; high of #21 in 2010)
UC Irvine (all but 14-17-18; high of #5 in 2010)
Wichita State (2010–15; high of #32 in 2010)
>> CNR preseason top-50 in five of past nine seasons (9 teams):
Houston (2014–18; high of #8 in 2015)
Sam Houston State (13-14-15-17-18; high of #30 in 2018)
Louisiana Lafayette (2014–18; high of #15 in 2016)
St. John’s (11-12-13-15-18; high of #24 in 2012)
Nebraska (10-14-15-17-18; high of #25 in 2015)
California (11-12-16-17-18; high of #12 in 2016)
East Carolina (10-12-13-14-16; high of #18 in 2017)
Florida Atlantic (11-13-14-16-17; high of #31 in 2014)
College of Charleston (11-12-13-15-16; high of #26 in 2011)
>> CNR preseason top-50 in four of past nine seasons (10 teams):
Texas Tech (2015–18; high of #3 in 2018)
Missouri State (12-13-16-18; high of #26 in 2016)
Long Beach State (10-16-17-18; high of #27 in 2017)
UCF (11-12-15-18; high of #30 in 2013)
Indiana (14-16-18; high of #7 in 2014)
Auburn (11-13-16-18; high of #22 in 2011)
UC Santa Barbara (2014–17; high of #23 in 2017)
Tulane (11-13-16-17; high of #36 in 2017)
Cal Poly (10-14-15-17; high go #27 in 2014)
Alabama (10-11-14-15; high of #26 in 2014)
>> CNR preseason top-50 in three of past nine seasons (12 teams):
Michigan (2016–18; high of #27 in 2016)
Maryland (2015–17; high of #20 in 2015)
UNC Wilmington (14-16-17; high of #36 in 2014)
New Mexico (13-14-17; high of #32 in 2013)
USC (12-16-17; high if #20 in 2016)
Liberty (11-14-15; high of #29 in 2015)
Kent State (11-13-15; high of #36 in 2013)
Pepperdine (10-13-15; high of #36 in 2010)
Kansas State (10-11-14; high of #18 in 2014)
Baylor (2011–13; high of #25 in 2011)
Georgia (10-12-13; high of #20 in 201)
Fresno State (2010–12; high of 332 in 2011)
>> CNR preseason top-50 in two seasons (since 2000), nine teams: San Diego State (16+18) … Gonzaga (10+17) … Notre Dame (13+16) … Illinois (15+16) … Missouri (10+16) … Washington State (11+15) … Virginia Tech (11+13) … Jacksonville (10+12) … and Minnesota (10+11).
Travis Swaggerty and his South Alabama teammates are ranked in the CB360 preseason Composite National Rankings for the first time in the nine-year history of the CNR, at No. 22. > photo courtesy South Alabama
____
>> The 108 programs that have appeared in the CNR preseason top-50 since 2010 include 33 with only one season in the preseason top-50: South Alabama, West Virginia, Wake Forest, BYU and Duke (all 2018) … Washington, Wright State & Southeastern Louisiana (all 2017) … Iowa (2016) … Kennesaw State, Tennessee, LMU & Ball State (all 2015) … Western Carolina, Mercer, UNLV and North Florida (all 2014) … Elon (2013) … Stetson, Georgia Southern, FIU, Troy, Texas State and Purdue (all 2012) … UConn, Pitt and Hawaii (2011) … Ohio State, Kansas, Oral Roberts, Middle Tennessee, FGCU and Boston College (all 2010).
• FROGS KEEP HOPPING: This marks the fourth time over the past nine seasons that TCU (#5) has been among the top-5 in the preseason CNR, also checking in at No. 3 in both the 2011 and ’15 preseason CNR, then No. 1 in 2017 (plus #11 in 2010, #13 in ’12, #12 in ’13, #22 in ’14 and #11 in ’16). The Frogs average starting position in the CNR from 2010–17 is 9.0, bested by only the SEC trio of Florida (5.9), LSU (7.0) and Vanderbilt (8.8)
TCU’s active streak of four straight CWS appearances includes being a semifinalist, a.k.a. bracket finalist, in 2015 (lost/eliminated in first game vs. Vanderbilt) and again in ’16 – when they lost twice vs. eventual NCAA champ Coastal Carolina, after the Frogs had opened the CWS with two wins … followed by yet another CWS semifinalist finish in 2017 (lost to eventual champ Florida). Back in 2010, TCU also was a CWS bracket finalist, losing to UCLA to end its historic run that season.
TCU’s haul of five CWS appearances during the previous eight seasons (2010–17) trails only Florida (6) for the most Omaha trips during that span. Florida also owns the most CWS appearances (5; in 2011, ’12, ’15, ’16 and ‘17) spanning the previous seven seasons (2011–16), followed by four for TCU and three each for Vanderbilt and Virginia.
• SEC AMONG TOP SPOTS: This marks the fifth time over the past seven seasons (all but Cal State Fullerton in 2014 and TCU in ’17) that a team from the Southeastern Conference has occupied the top spot in the CB360 preseason CNR top-50 (Florida in 2012, ’16 and ’17; Arkansas ’13; Vanderbilt ’15). Since 2010, when Texas held the top spot, Florida is the only team that has been #1 in the CNR preseason top-50 more than once. UCLA sat atop the preseason CNR in 2011.
The 2016 preseason CNR remains the only time over the past nine seasons (2010–18) that three teams from the same conference have occurred the top-3 spots: Florida, Vanderbilt and Texas A&M (all from the SEC, as was #5 LSU in that 2016 preseason CNR).
In a sampling of the 2010-18 CNR preseason top-50, it has been somewhat rare for even two teams from the same conference to be among the top-3. Spanning this nine-year span, there have been only three years with two of the top-3 teams in the CNR preseason top-50 from the same conference: 2012 (Florida and South Carolina), 2013 (Arkansas and Vanderbilt) and 2017 (Florida and LSU). From 2011-18, Florida leads the way with being a CNR preseason top-3 in five different seasons, followed by TCU and Vanderbilt with three each. Cal State Fullerton, LSU, Oregon State and Virginia each have been top-3 in two CNR preseason rankings since 2010, with one each for Texas, UCLA, South Carolina, Stanford, Arkansas, North Carolina, Texas A&M and Texas Tech (one of four teams from Texas among the above group).
• CNR PRESEASON TOP-3 HISTORY: See listing below for how the CNR preseason top-3 have shaken out over the past nine seasons. Note that Virginia, in 2015, and Florida 2018 are the only eventual CWS champions among the 24 teams on this list from 2010–17 … while five different CWS runner-up teams recently have come from the CNR preseason top-3, during the previous seven seasons alone (Florida ’11; South Carolina ’12; UVa ’14; Vanderbilt ’15; & LSU ‘17). In two of the past three years, the preseason CNR top-3 accurately forecasted the College World Series finalists: UVa & Vandy in 2015, and Florida & LSU in ’17. All told, five of the previous eight seasons of the CNR have included at least one of the CWS finalists among the CNR preseason top-3 (all but 2010, ’13 and ’16):
2010: [1] Texas … [2] LSU … [3] Cal State Fullerton
2011: [1] UCLA … [2] Florida# … [3] TCU
2012: [1] Florida … [2] South Carolina# … [3] Stanford
2013: [1] Arkansas … [2] North Carolina … [3] Vanderbilt
2014: [1] Cal State Fullerton … [2] Oregon State … [3] Virginia#
2015: [1] Vanderbilt# … [2] Virginia* … [3] TCU
2016: [1] Florida … [2] Vanderbilt … [3] Texas A&M
2017: [1] TCU … [2] Florida* … [3] LSU#
2018: [1] Florida … [2] Oregon State … [3] Texas Tech
* = won CWS title #=CWS runner-up
CB360’s CNR FORMULA for the 2018 preseason includes the following 13 elements:
• National Coaches Poll (USA Today/ESPN; 58 total teams)
• National Collegiate Baseball Writers poll (53 total teams)
• DIBaseball.com preseason top-25, in conjunction with projected NCAA Tournament field (48 teams)
• Baseball America top-25 poll
• Collegiate Baseball magazine rankings (preseason top-40)
• Perfect Game preseason rankings (30 total teams)
• Massey preseason computerized rankings (top-60 teams)
• Bennett Rank computerized rankings (top-60 teams)
• Moore preseason computerized rankings (top-60 teams)
• DISportsNet computerized rankings (top-60 teams)
• Projected season strength of schedule (per Massey; bonus points, max. 1.0)
• Assorted Conference preseason coaches polls (bonus points, max. 1.0)
> SEC … ACC … Pac-12 … Big 12 … Big Ten … Big West … C-USA
AAC … MVC … Mt West … Sun Belt … WCC … Southland
Note: scroll down near bottom of this page for complete 2018 preseason CB360 Top-50 – plus the final 2014, ’15, ’16 and ’17 CB360 Top-50 (mid-May, prior to postseason) and the preseason Top-50 for each of the previous eight seasons (2010–17).
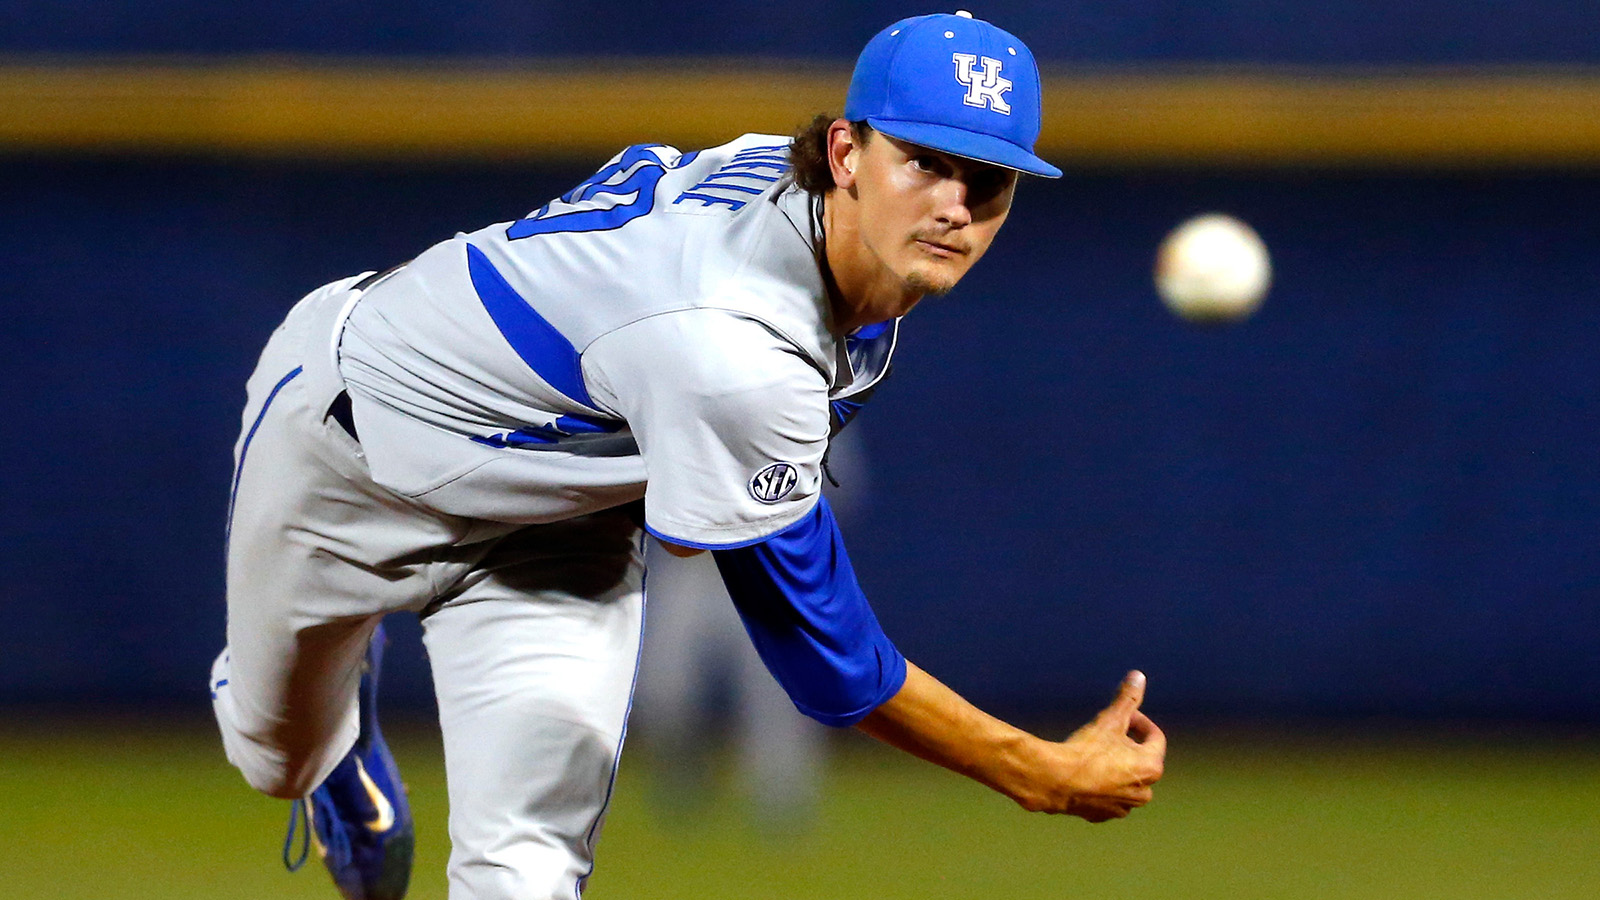
One year after not being ranked anywhere in the CB360 preseason Composite National Rankings top-50, Kentucky and 2017 SEC Pitcher of the Year Sean Hjelle enter 2018 with the highest preseason ranking (CNR #8) in program history. > photo courtesy UK
____
• PROJECTING THE POSTSEASON ELITE – Based on the preseason CNR, the following teams project to be NCAA tournament top-8 seeds (and, if form holds, 2018 CWS participants): Florida, Oregon State, Texas Tech, Florida State, TCU, North Carolina, Arkansas & Kentucky. The CNR projects those eight teams plus the following eight as 2018 NCAA Regional No. 1 seeds/likely hosts (top-16 national seeds): LSU, Louisville, Stanford, Vanderbilt, Texas A&M, UCLA, Cal State Fullerton & Virginia.
The top-8 projected NCAA seeds/CWS participants include three SEC teams, two ACC, two Big 12, one Pac-12. The 16 projected NCAA Regional hosts/national seeds include six SEC, four ACC, three Pac-12, two Big 12 and one Big West.
> One year ago in 2017, these eight teams projected to be NCAA tournament seeds (and, if form held, 2018 CWS participants): TCU, Florida, LSU, Florida State, Vanderbilt, South Carolina, Louisville and Oregon State (all but Vandy and S.C. made it to the 2018 CWS). The CNR projects those eight teams plus the following eight as 2017 NCAA Regional No. 1 seeds/likely hosts: Coastal Carolina, Arizona, Cal State Fullerton, North Carolina, Clemson, NC State, Oklahoma State and Virginia (Fullerton made it on to the CWS, as did Texas A&M from outside the regional host group). The eight projected 2017 NCAA seeds/CWS participants included four SEC teams, two ACC, one Big 12 and one Pac-12. The 16 projected 2018 NCAA Regional hosts include six ACC, four SEC, two each from the Pac-12 and Big 12, plus one Big West and one Sun Belt.
> Two years ago (per the preseason CNR), these eight projected to be 2016 NCAA tournament seedsand CWS participants: Florida, Vanderbilt, Texas A&M, Louisville, LSU, Miami, Virginia & Oregon St (only Florida and Miami made it to Omaha). The CNR projected those eight teams plus the following eight as 2016 NCAA Regional hosts: UCLA, Oklahoma St, TCU, Cal, Florida St, Oregon, La.-Lafayette and CS Fullerton (OK St. and TCU did one step better, making it to the ’16 CWS). … The eight projected 2016 NCAA seeds/CWS participants included four SEC teams, three ACC and one Pac-12. The 16 projected NCAA Regional hosts included four each from the SEC, ACC and Pac-12 (plus two Big 12, and one each from the Sun Belt and Big West).
> And three years back, the 2015 preseason CNR proved to be incredibly accurate, as the preseason #1 and #2 (Vanderbilt and Virginia) both reached the CWS finals (won by UVa), while the CNR preseason #3 teams TCU and Florida both ended up reaching the CWS semifinals/bracket finales. The #5 team in the preseason CNR (LSU) also made it all the way to Omaha in 2015 … but the #6-#8 teams were knocked off in earlier rounds (UCLA, Oklahoma State and Houston). … Among the “second eight” (9th-16th) in the 2015 preseason CNR, Cal State Fullerton joined the #1-#5 teams at the 2015 CWS (as did Miami, #18 in the preseason CNR, and Arkansas, which opened the ’15 season all the way down at #36 in the CNR top-50).
… SURPRISE CHAMPIONS – In recent years, college baseball has been a volatile sport, both in the regular season and the NCAA Tournament. In fact, five of the past seven teams that were preseason No. 1 in the CNR – UCLA (2011), Florida (’12), Arkansas (’13), Cal State Fullerton (’14) and TCU (’17) – failed to ultimately even reach the CWS for that season … Vanderbilt was a 2015 CWS participant (runner-up), after being the CNR preseason #1, while Florida similarly was the 2016 CNR preseason #1 and ended up reaching the CWS.
Here’s where the past seven CWS champions were ranked in the preseason CNR for that season (only two top-8 and four top-10, with an avg. rank of 12.9 – essentially projecting a little off the fringe for even making the CWS for that season):
• [CNR preseason #20] South Carolina (2010)
• [9] South Carolina (2011)
• [14] Arizona (2012)
• [5] UCLA (2013)
• [10] Vanderbilt (2014)
• [2] Virginia (2015)
• [30] Coastal Carolina (2016)
• [2] Florida (2017)
… And here are the teams that have been CWS runner-up during the past eight seasons, preceded by where they ranked in the preseason CNR for that season (interesting to note that four in a five-year span all were among the top-3 in the preseason CNR, before Arizona rose from outside the preseason top-50 to reach the 2016 CWS finals … followed by CNR preseason #3 LSU ended up as the CWS runner-up):
• [CNR preseason #25] UCLA (2010)
• [2] Florida (2011)
• [2] South Carolina (2012)
• [13] Mississippi State (2013)
• [3] Virginia (2014)
• [1] Vanderbilt (2015)
• [X] Arizona (2016)
• [3] LSU (2017)
SET UP FOR OMAHA? – Preseason hype, more often than not, does not predict actual postseason glory … here’s a look at recent CNR Preseason Top-8 teams that have ended up in the CWS later that season (avg. of only 3.0 per year, including only one of the preseason top-8 in 2010 and again in 2014, with a high of five in 2015 before six in 2017, all but Vanderbilt & South Carolina):
2010 CWS– only one team: CNR preseason #7 Florida State
(did not reach CWS: 1–Texas, 2–LSU, 3–Fullerton, 4–Virginia, 5–UC Irvine, 6–Rice, 8–Georgia Tech)
2011– three teams: CNR preseason #2 Florida, (4) Vanderbilt & (6) Texas
(did not reach CWS: 1–UCLA, 3–TCU, 5–OU, 7–Clemson, 8–CSF)
2012– three teams: (1) Florida, (2) South Carolina & (8) Arkansas
(did not reach CWS: 3–Stanford, 4–UNC, 5–A&M, 6–Rice, 7–Texas)
2013– three teams: (2) North Carolina, (4) LSU & (5) UCLA
(did not reach CWS: 1–Arkansas, 3–Vandy, 6–Stanford, 7–SC, 8–Oregon)
2014– only one team: (3) Virginia
(did not reach CWS: 1–CSF, 2–Oregon St, 4–Miss. St, 5–FSU, 6–LSU, 7–IU and 8–NC St
… the ’Pack did not even reach the NCAAs)
2015– five teams: (1) Vanderbilt, (2) Virginia, (3) TCU, (4) Florida and (5) LSU
(did not reach CWS: 6–UCLA, 7–Oklahoma State and 8–Houston)
2016– two teams: [1] Florida & [6] Miami
… plus [10] OK St, [11] TCU, [30] Coastal, [35] Texas Tech, [45] UCSB & [X] Arizona
(did not reach CWS: 2–Vanderbilt, 3–Texas A&M, 4–Louisville, 5–LSU, 7–Virginia, 8–Oregon State)
2017 – six teams: [1] TCU, [2] Florida, [3] LSU, [4] Florida State, [7] Louisville & [8] Oregon State
… plus [11] CS Fullerton & [20] Texas A&M
(did not reach CWS: 5–Vanderbilt & 6–South Carolina)
PREDICTABLY UNPREDICTABLE – Spanning the 2012-16 seasons, six different teams – Kent State (’12), Stony Brook (’12), Indiana (’13), Texas Tech (’14), UC Irvine (’14) and Arizona (’16) – reached the College World Series after not even being in the CB360 preseason top-50.
• Teams outside the CNR preseason top-8 that ultimately reached the CWS later that season, during the past eight years (40 teams, or 5.0 per year, from 2010-17):
(–) Kent State, in 2012
(–) Stony Brook, in 2012
(–) Indiana, in 2013
(–) Texas Tech, in 2014
(–) UC Irvine, in 2014
(–) Arizona, in 2016
(CNR preseason #45) UC Santa Barbara, in 2016
(36) Arkansas, in 2015
(35) Texas Tech, in 2016
(32) Ole Miss, in 2014
(30) North Carolina, in 2011
(30 Coastal Carolina, in 2016
(28) Oklahoma, in 2010
(25) UCLA, in 2010
(24) California, in 2011
(23) Texas, in 2014
(22) TCU, in 2014
(20) South Carolina, in 2010
(20) Texas A&M, in 2017
(18) Miami, in 2015
(16) UCLA, in 2012
(16) Louisville, in 2013
(16) Cal State Fullerton, in 2015
(15) Virginia, in 2011
(14) Texas A&M, in 2011
(14) Arizona, in 2012
(14) Louisville, in 2014
(13) Mississippi State, in 2013
(12) Clemson, in 2010
(12) Florida State, in 2012
(11) TCU, in 2010
(11) TCU, in 2016
(11) CS Fullerton, in 2017
(10) Arizona State, in 2010
(10) North Carolina State, in 2013
(10) Vanderbilt, in 2014
(10) Oklahoma State, in 2016
(9) Florida, in 2010
(9) South Carolina, in 2011
(9) Oregon State, in 2013
>> teams listed above, by year: 7 in 2010 … 5 in 2011 … 5 in 2012 … 5 in 2013 … 7 in 2014 … 3 in 2015 … 6 in 2016 … 2 in 2017 (avg. 5.0 per year; 5-plus every year from 2010-14 plus ’16)
The final CNR top-50 during the 2016 season (mid-May, prior to postseason) included 42 teams (27 of the top-28; 32 of the top-35) that ultimately earned berths in the 2016 NCAA Tournament – all except for: (23) North Carolina … (29) Michigan … (31) BYU … (36) California … (41) Oregon State … (42) Kent State … (43) Long Beach State … and (49) Creighton.
> The final CNR release during the 2015 season (mid-May, prior to postseason) included 38 teams that ultimately earned berths in the 2015 NCAAs – all except: (23) Nevada, (31) UNC, (32) North Florida, (33) Ohio St, (35) Irvine, (38) Ga Tech, (42) Southeastern Louisiana, (43) Michigan St, (45) So. Miss., (48) Nebraska, (49) So. Alabama & (49) Missouri. … That number (38) was down from the 42 teams, later replicated in 2016 from the final CNR top-50 release during the 2014 season (mid-May, prior to postseason) that went on to earn berths in the 2014 NCAAs – all except for: (26) Mercer, (31) West Virginia, (32) FIU, (37) USD, (38) UCF, (42) New Mexico, (44) UCSB & (47) Tennessee.
CONFERENCE CALL – Here is the breakdown, by conference (20 alone are from the SEC or ACC; more than 60%, 31, are from the SEC/ACC/Big 12/Pac-12 and 37 of the 50 are from these six leagues: SEC/ACC/Big 12/Pac-12/Sun Belt/Big Ten. The total number of leagues represented in the top-50 (13) is relatively low (only 10 leagues have multiple top-50 teams, and only six with three-plus):
• 10 SEC teams (1 top-4; 3 top-8; 6 top-16; 8 top-25) – (1) Florida, (7) Arkansas, (8) Kentucky, (9) LSU, (12) Vanderbilt, (13) Texas A&M, (19) Mississippi State, (20) Ole Miss, (26) South Carolina & (36) Auburn
• 10 ACC teams (1 top-4; 2 top-8; 4 top-16; 6 top-25) – (4) Florida State, (6) North Carolina, (10) Louisville, (16) Virginia, (18) Clemson, (24) NC State, (28) Miami, (39) Wake Forest, (42) Georgia Tech & (47) Duke
• 6 Big 12 teams (1 top-4; 2 top-8; 3 top-25): – (3) Texas Tech, (5) TCU, (17) Texas, (33) West Virginia, (38) Oklahoma State & (40) Oklahoma
• 5 Pac-12 teams (1 top-8; 3 top-16; 4 top-25): – (2) Oregon State, (11) Stanford, (14) UCLA, (25) Arizona & (45) California
• 3 Sun Belt Conf. teams – (22) South Alabama, (34) Louisiana-Lafayette & (49) Coastal Carolina
• 3 Big Ten teams – (35) Indiana, (41) Michigan & (44) Nebraska
• 2 Big West teams (1 top-16) – (15) Cal State Fullerton &
(31) Long Beach State
• 2 Conference USA teams (1 top-25) – (21) Southern Miss. & (46) Rice
• 2 American Athletic Conf. teams (1 top-25) – (23) Houston & (32) UCF
• 2 Missouri Valley Conf. teams – (27) Dallas Baptist & (29) Missouri State
• 2 West Coast Conf. teams – (38) San Diego & (45) BYU
• 1 each (3 teams) – Southland (#30 Sam Houston State), Big East (#43 St. John’s) and Mountain West (#50 San Diego State)
… The SEC total in the 2018 CNR preseason top-50 soared back up to 10, after being down at seven in 2017, following 11 in each of the prior two seasons (2015-16) for 39 total in the four-year span from 2015-18 … The ACC is 2nd with 33 preseason CNR teams over the past four seasons, followed by: Pac-12 (25), Big 12 (19), Big West (14), Big Ten (14), American Athletic (9), Conf. USA (8), Missouri Valley (7), Sun Belt (7), WCC (6), Colonial (4), Southland (4), Mt. West (3), Big South (2), Mid-American (2), Big East (2) and one each for the Atlantic Sun and Horizon …
> One year earlier, in 2017, here’s how the preseason CNR top-50 broke down by conference:
• 9 Pac-12 teams (1 top-8; 2 top-16; 4 top-25): – (8) Oregon State, (10) Arizona, (22) Stanford, (24) Washington, (34) Arizona State, (43) UCLA, (44) USC, (45) California & (47) Oregon
• 8 ACC teams (2 top-8; 6 top-16; 7 top-25 ) – (4) Florida State, (7) Louisville, (12) North Carolina, (13) Clemson, (14) NC State, (16) Virginia, (19) Miami & (28) Georgia Tech
• 7 SEC teams (2 top-4; 4 top-8; 4 top-16; 6 top-25) – (2) Florida, (3) LSU, (5) Vanderbilt, (6) South Carolina, (20) Texas A&M, (25) Ole Miss & (32) Mississippi State
• 4 Big 12 teams (2 top-16; 3 top-25): – (1) TCU, (15) Oklahoma St., (21) Texas Tech & (33) Texas
• 4 Big West teams (1 top-16; 2 top-25) – (11) Cal State Fullerton, (23) UC Santa Barbara, (27) Long Beach St. & (50) Cal Poly
• 3 American Athletic Conf. teams (1 top-25) – (18) East Carolina, (30) Houston & (36) Tulane
• 3 Conference USA teams – (26) Rice, (38) Florida Atlantic & (42) Southern Miss.
• 3 Big Ten teams – (31) Maryland, (40) Michigan & (46) Nebraska
• 2 Sun Belt Conf. teams (1 top-16) – (9) Coastal Carolina & (17) Louisiana-Lafayette
• 2 Southland Conf. teams – (35) Sam Houston State & (49) Southeastern Louisiana
• 1 each (5 teams) – Missouri Valley (#29 Dallas Baptist) … Colonial (#37 UNC Wilmington) … West Coast (#39 Gonzaga) … Mountain West (#41 New Mexico) … Horizon (#48 Wright State)
> Two years ago, in 2016, here’s how the preseason CNR top-50 broke down by conference:
• 2016 CNR PRESEASON CONFERENCE CALL – All but three of the 14 teams in the Southeastern Conference were included in the 2016 CB360 preseason top-50 … here was the breakdown, by conference (35 of 50 from these five leagues: SEC, ACC, Pac-12, Big 12 and Big Ten):
11 SEC teams (3 top-4; 4 top-8; 4 top-16; 6 top-25) – (1) Florida, (2) Vanderbilt, (3) Texas A&M, (5) LSU, (18) Arkansas, (22) Mississippi St, (29) SC, (31) Ole Miss, (32) Kentucky, (43) Mizzou & (47) Auburn
8 ACC teams (3 top-8; 4 top-16; 6 top-25 ) – (4) Louisville, (6) Miami, (7) Virginia, (13) Florida State, (19) North Carolina State, (23) North Carolina, (33) Notre Dame & (39) Georgia Tech
6 Pac-12 teams (1 top-8; 4 top-16; 5 top-25): – (8) Oregon State, (9) UCLA, (12) California, (14) Oregon, (20) USC & (38) Arizona State
5 Big 12 teams (2 top-16; 3 top-25): – (10) OK St., (11) TCU, (25) Texas, (34) Okla. & (35) TX Tech
5 Big Ten teams (1 top-25) – (24) Maryland, (27) Michigan, (36) Indiana, (42) Illinois & (48) Iowa
4 Big West teams (1 top-16; 1 top-25) – (16) Fullerton, (44) UC Irvine, (45) UCSB & (49) Long Beach St.
2 American Athletic Conf. teams (1 top-25) – (17) Houston & (40) Tulane
2 Conference USA teams (1 top-25) – (21) Rice & (46) Florida Atlantic
2 Missouri Valley teams – (26) Missouri State & (28) Dallas Baptist
2 Colonial Athletic Assoc. teams – (37) College of Charleston & (50) UNC Wilmington
1 each (3 teams) – Sun Belt (#15 Louisiana-Lafayette) … Big South (#30 Coastal Carolina) … Mountain West (#41 San Diego State)
> And three years ago, in 2015, here’s how the preseason CNR top-50 broke down by conference:
• 2015 CNR PRESEASON CONFERENCE CALL – All but there of the 14 teams in the Southeastern Conference were included in the 2015 CB360 preseason top-50:
11 SEC teams (3 top-8; 4 top-16; 6 top-25) – (1) Vandy, (4) Florida, (5) LSU, (11) SC, (19) Miss. St., (24) Ole Miss, (30) TN, (33) A&M, (35) AL, (36) ARK & (49) Kentucky.
7 ACC teams (1 top-8; 4 top-16; 5 top-25 ) – (2) UVa, (10) Louisville, (12) UNC, (13) FSU, (18) Miami, (27) Clemson & (39) Ga. Tech
5 Pac-12 teams (1 top-8; 2 top-16; 4 top-25): – (6) UCLA, (15) ASU, (21) Oregon, (22) Stanford & (31) Oregon St.
4 Big 12 teams (2 top-8; 3 top-16; 4 top-25) – (3) TCU, (7) Oklahoma St., (9) Texas & (17) Texas Tech
4 Big West teams (1 top-16; 2 top-25) – (16) Fullerton, (25) UCSB, (28) Cal Poly & (41) UC Irvine
3 Big Ten teams (1 top-25 team) – (20) Maryland, (26) Nebraska & (37) Illinois
3 West Coast Conf. teams – (32) LMU, (45) Pepperdine & (48 ) San Diego
2 American Athletic Conf. teams (1 top-8) – (8) Houston & (38) UCF)
2 Mid-American Conf. teams – (42) Kent State & (46) Ball State
2 Missouri Valley teams – (43) Wichita State & (50) Dallas Baptist
1 each (7 teams) – Conf. USA (#14 Rice) … Atlantic Sun (#23 Kennesaw) … Big South (#29 Liberty) … Colonial (#34 Coll. Charleston) … BIG EAST (#40 St. John’s) … Southland (#44 La.-Lafayette) …
Sun Belt (#47 Sam Houston)
_______________
WHAT A DIFFERENCE A YEAR MAKES – The following 15 teams find themselves in the CB360 2018 preseason top-50, after not being in the 2017 preseason top-50:
(7) Arkansas
(8) Kentucky
(22) South Alabama
(29) Missouri State
(32) UCF
(33) West Virginia
(35) Indiana
(36) Auburn
(38) San Diego
(39) Wake Forest
(40) Oklahoma
(43) St. John’s
(45) BYU
(47) Duke(50) San Diego State
>> One year earlier, these 13 teams found themselves in the CB360 2017 preseason top-50, after not being in the 2016 preseason top-50:
(10) Arizona
(13) Clemson
(18) East Carolina
(22) Stanford
(24) Washington
(35) Sam Houston State
(39) Gonzaga
(41) New Mexico
(42) Southern Mississippi
(46) Nebraska
(48) Wright State
(49) Southeastern Louisiana
(50) Cal Poly
> Two years ago, these 17 teams (one-third of the total) cracked the 2016 CNR preseason top-50 after not being among the 2015 preseason top-50: (12) Cal, (19) NC St., (20) USC, (26) Missouri St., (27) Mich., (30) Coastal Carolina, (33) Notre Dame, (34) Okla., (36) Indiana, (40) Tulane, (41) San Diego St., (43) Missouri, (46) FAU, (47) Auburn, (48) Iowa, (49) Long Beach St. & (50) UNCW … and three years ago, these 14 teams cracked the 2015 CNR preseason top-50 after not being among the 2014 preseason top-50: (17) Texas Tech, (20) Maryland, (23) Kennesaw, (30) Tenn., (32) LMU, (34) Charleston, (37) Illinois, (38), UCF, (40) St. John’s, (41) Irvine, (42) Kent St., (45) Pepperdine, (46) Ball St. & (50) Dallas Baptist.
… While these five teams jumped up 17 or more spots from the 2016 preseason top-50 to the 2017 preseason top-50:
South Carolina (opened 2016 at #29 in the CNR; now starting at #6)
UC Santa Barbara (#45 to #23)
Long Beach State (#49 to #27)
Coastal Carolina (#30 to #9)
Texas Tech (#38 to #21)
> Similarly, these seven teams made big leaps from the 2015 preseason top-50 to the 2016 preseasontop-50: Texas A&M (opened 2015 at #33 in the CNR; then started 2016 at #3), La.-Lafayette (#44 to #15), Oregon St (#31 to #8), NC St (#41 to #19), Dallas Baptist (#50 to #28), Arkansas (#36 to #18) & Kentucky (#49 to #32) … and two years ago, these six teams make big leaps from the 2014 preseason top-50 to the 2015 preseason top-50: Houston (#50 to #8), Stanford (#42 to #22), TCU (#22 to #3), Liberty (#45 to #29), Florida (#19 to #4) & OK St. (#20 to #7).
… And these six teams, led by four Pac-12 powers, dropped the most from 2016 preseason to 2017 preseason (while remaining in the top-50 from one preseason to the next):
UCLA (#9 in 2016 preseason CNR; now starting 2017 at #43)
California (#12 to #45)
Oregon (#14 to #47)
USC (#20 to #44)
Texas A&M (#3 to #20)Texas Tech (#35 to #21)
> … A couple years ago, these five teams dropped the most from 2015 preseason to 2016 preseason (while remaining in the top-50 from one preseason to the next): Arizona St. (#15 in 2015 preseason CNR; then started 2016 at #38), UCSB (#25 to #45), So. Carolina (#11 to #29), Texas Tech (#17 to #35) & Texas (#9 to #25) … and three years ago, these five teams had dropped 15-plus spots from the 2014 preseason top-50 to the 2015 preseason top-50: Oregon St. (#2 to #31), La.-Lafayette (#24 to #44), Fullerton (#1 to #16), Mississippi St. (#4 to #19) & San Diego (#33 to #48).
________________
SURGING, REFOCUSING & REBUIDLING – The following nine teams were not in the final CNR top-50 release in 2017 (mid-May, prior to postseason) but are in the 2018 preseason top-50, with several very notable programs (former CWS champs, etc.) included in this list:
(27) Dallas Baptist
(28) Miami
(34) Louisiana (Lafayette)
(37) Oklahoma State
(42) Georgia Tech
(46) Rice
(47) Duke
(48) California
(49) Coastal Carolina
(each from 2014-17, a total of 12 or 13 teams entered the preseason CNR top-50 after not being in the final regular-season CNR top-50 from the previous season … with that number dipping to only nine in 2018)
>> The following 10 teams were not in the final CNR top-50 release in 2016 (mid-May, prior to postseason) but were in the 2017 preseason top-50, with several very notable programs (former CWS champs, etc.) included in this list:
(22) Stanford
(30) Houston
(31) Maryland
(33) Texas
(35) Sam Houston State
(41) New Mexico
(43) UCLA
(44) USC
(47) Oregon
(50) Cal Poly
> Two years ago, these 13 teams cracked the 2016 preseason CNR after not being in the final (mid-May) 2015 CNR top-50): (14) Oregon, (15) La.-Lafayette, (22) Mississippi St., (25) Texas, (27) Mich., (29) So. Carolina, (32) Kentucky, (34) Okla., (35) Texas Tech, (36) Indiana, (41) San Diego St., (49) Long Beach State, (50) UNCW … going three years back, these 12 teams were in the 2015 preseason CNR after not being in the final 2014 CNR top-50: (6) UCLA, (12) UNC, (16) Fullerton, (20) Maryland, (23) Kennesaw St., (32) LMU, (34) Charleston, (37) Illinois, (40) St. John’s, (42) Kent St., (43) Wichita St. & (46) Ball St.
• … And these teams made the biggest jump while staying within the top-50, since late in the 2017 season to the 2018 preseason:
UCLA (#40 to #14)
NC State (#48 to #24)
Ole Miss (#43 to #20)
South Alabama (#44 to #22)
Florida State (#26 to #4)
Sam Houston State (#50 to #30)
Vanderbilt (#23 to #12)
Indiana (#46 to #35)
>> One year earlier, these teams made the biggest jump while staying within the top-50, since late in the 2016 season to the 2017 preseason:
Oregon State (#41 to #8)
East Carolina (#45 to #18)
Long Beach State (#43 to #27)
UC Santa Barbara (#37 to #23)
Washington (#38 to #24)
> Going back two years, these teams made big jumps within the CNR top-50 (from end of 2015 regular season to 2016 preseason): Virginia (#34 to #7), NC St. (#41 to #19), Cal (#26 to #12) & Oregon St. (#21 to #8) … and three years ago, these teams made big jumps within the CNR top-50 (from end of 2014 regulars season to 2015 preseason): Arizona St. (#46 to #15), Stanford (#42 to #22) and UCSB (#44 to #25).
• On the flip side, the following nine teams are not in the 2018 CB360 preseason top-50 but were in the final CNR top-50 late in the 2017 season (mid-May, prior to postseason):
(20) South Florida
(32) Baylor
(34) LMU
(37) Louisiana Tech
(38 Maryland
(39) Southeastern Louisiana
(41) New Mexico
(42) Old Dominion
(49) Washington
>> One year earlier, the following 10 teams were not in the 2017 CB360 preseason top-50 but were in the final CNR top-50 late in the 2016 season (mid-May, prior to postseason):
(30) Minnesota
(31) BYU
(34) Bryant
(39) South Alabama
(42) Kent State
(44) Louisiana Tech
(46) Duke
(47) Wake Forest
(48) Ohio State
(49) Creighton
> Two years ago, there were 13 teams that were in the final 2015 regular-season CNR but not in the 2016 preseason top-50: (23) Nevada, (24) Radford, (30) Oral Roberts, (32) No. Florida, (33) Ohio St., (40) Bradley, (42) Southeastern Louisiana, (43) Mich. St., (44) East Carolina, (45) So. Miss., (46) So. Florida, (48) Neb. & (49) So. Ala.
… three years ago, 12 teams that were in the top-50 of the final 2014 CNR, at end of the regular season, were not in the 2015 preseason CNR top-50: (8) Indiana, (11) Wash., (26) Mercer, (28) Indiana St., (31) West Virginia, (32) FIU, (33) UNLV, (40) Kansas, (41) Bryant, (42) New Mexico, (45) San Diego State & (48) Old Dominion
… and going four years back, 15 teams that were in the top-50 of the final 2013 reg.-season CNR were not in the 2014 preseason CNR top-50: (17) So. Alabama, (19) Va. Tech, (23) Troy, (29) Pittsburgh, (30) Campbell, (37) So. Florida, (41) Seton Hall, (42) Gonzaga, (43) Michigan St., (44) Austin Peay, (45) Maryland, (46) UC Irvine, (47) Notre Dame, (48) Illinois & (50) Ohio St.
• … And these teams have made quick falls (while staying within the top-50) from late in 2017 to the 2018 preseason top-50:
Wake Forest (#12 to #39)
Michigan (#22 to #41)
Long Beach State (#15 to #31)
St. John’s (#28 to #43)
Oklahoma (#27 to #40)
Arizona (#14 to #25)
Auburn (#25 to #36)
Nebraska (#33 to #44)
Southern Miss. (#11 to #21)
Missouri State (#19 to #29)
Clemson (#7 to #18)
>> One year earlier, these teams made quick falls (while staying within the top-50) from late in 2016 to the 2017 preseason top-50:
Southern Miss. (#12 to #42)
Mississippi State (#5 to #32)
Ole Miss (#7 to #25)
Miami (#3 to #19)
Texas A&M (#4 to #20)
Tulane (#20 to #36)
Florida Atlantic (#22 to #38)
Texas Tech (#6 to #21)
> Again, looking at the previous year, these eight teams had the biggest plunge while still staying in the top-50 (from late 2015 to 2016 preseason: Illinois (#4 to #42), UCSB (#14 to #45), Iowa (#18 to #48), FAU (#46 to #20), Coll. of Charleston (#15 to #37), Dallas Baptist (#9 to #28), Missouri St. (#10 to #26) & Ariz. St. (#22 to #38) … and there years ago, the biggest drop-offs (from late 2014 to 2015 preseason): La.-Lafayette (#3 to #44), Ore. St. (#2 to #31), Cal Poly (#6 to #28), Pepperdine (#25 to #45), UC Irvine (#22 to #41) & Kentucky (#29 to #49).
• … Finally, these 15 teams (roughly one-third of the total) were in the 2017 CB360 preseason top-50 but are not in the 2018 preseason top-50 (all based on Composite National Rankings formula):
East Carolina [2017 CNR preseason #18]
UC Santa Barbara [23]
Washington [24]
Maryland [31]
Arizona State [34]
Tulane [36]
UNC Wilmington [37]
Florida Atlantic [38]
Gonzaga [39]
New Mexico [41]
USC [44]
Oregon [47]
Wright State [48]
Southeastern Louisiana [49]
Cal Poly [50]
(sampling the past four years, on average there have been 15 teams that were part of the final regular-season top-50 one season but outside the top-50 when the next preseason CNR rolled around)
>> One year earlier, these 13 teams (one-fourth of the total) were in the 2016 CB360 preseason top-50 but were not in the 2017 preseason top-50:
Arkansas [2016 CNR preseason #18]
Missouri State [26]
Kentucky [32]
Notre Dame [33]
Oklahoma [34]
Indiana [36]
College of Charleston [37]
San Diego State [41]
Illinois [42]
Missouri [43]
UC Irvine [44]
Auburn [47]
Iowa [48]
> Most notably, two years ago, there were even more teams (17; one-third of the total) that were in the 2015 CB360 preseason top-50 but not in the 2016 preseason top-50:
Stanford (2015 CB360 preseason #22)
Kennesaw State (23)
Nebraska (26)
Clemson (27)
Cal Poly (28)
Liberty (29)
Tennessee (30)
Loyola Marymount (32)
Alabama (35)
Central Florida (UCF) (38)
St. John’s (40)
Kent State (42)
Wichita State (43)
Pepperdine (45)
Ball State (46)
Sam Houston State (47)
San Diego (48)
> And there were 15 teams that were in the 2014 preseason top-50 but not in the 2015 preseason top-50: Indiana (2014 CB360 preseason #7), NC St. (8), Kansas St. (18), Arizona (28), E. Carolina (29), FAU (31), Oklahoma (34), UNC Wilmington (36), W. Carolina (38), New Mexico (40), Coastal Carolina (43), Mercer (t46), UNLV (t46), Washington St. (t46) & No. Florida (50) … 20 months removed from competing in the 2013 CWS, Indiana and NC State found themselves outside the CNR preseason top-50 in 2015.
________________________
COMPOSITE NATIONAL RANKINGS (CNR) CRITERIA: Teams receive points based on their standings in each poll/rating/projection (60 pts for #1; 59 for #2, etc.). For polls involving voting points (coaches and CB) and the various RPI-type ratings, the CNR adjusts to reward teams that have larger margins in the voting/point totals (whereas two teams with nearly the same voting-point total will be closer in the CNR allotment for that poll). Note that strength-of-schedule typically is factored into RPI formulations … thus the actual SOS numbers only are used early in the season (SOS are not used in the CNR when RPI already are in the mix). For the NCAA field projections, teams are awarded CNR points based on their respective seedings, “last in” and “last out,” etc.
The polls/ratings/projections are averaged, with 40 points typically then added to each total in order to yield the 100-point benchmark. Early in the season (projected SOS; and preseason conference coaches polls) and late in the season (final-10 games), a maximum bonus/penalty of 2.0 (SOS & conf. poll) or 0.5 points (final-10) is factored into the formula (in that case, 38.0, or 39.5, rather than 40, is added to the poll/rating/projection avg.).
CB360’s CNR FORMULA for the 2018 preseason includes the following 12 elements:
• National Coaches Poll (USA Today/ESPN; 58 total teams)
• National Collegiate Baseball Writers poll (53 total teams)
• DIBaseball.com preseason top-25, in conjunction with projected NCAA Tournament field (48 teams)
• Baseball America top-25 poll
• Collegiate Baseball magazine rankings (preseason top-40)
• Perfect Game preseason rankings (30 total teams)
• Massey preseason computerized rankings (top-60 teams)
• Bennett Rank computerized rankings (top-60 teams)
• Moore preseason computerized rankings (top-60 teams)
• DISportsNet computerized rankings (top-60 teams)
• Projected season strength of schedule (per Massey; bonus points, max. 1.0)
• Assorted Conference preseason coaches polls (bonus points, max. 1.0)
> SEC … ACC … Pac-12 … Big 12 … Big Ten … Big West … C-USA
AAC … MVC … Mt West … Sun Belt … WCC … Southland
(keep scrolling down for CNR archive, some preseason and final regular-season, dating back to 2010)
CB360 Preseason Composite Top-50 Rankings for 2018
(rank) Team – voting pts (final 2017 CNR, at end of reg. season) [2017 preseason CNR]
1. Florida – 97.79 (#8 in final 2017 top-50/ed reg.-season) [#2 in 2017 CR preseason top-50]
2. Oregon State – 96.94 (1) [8]
3. Texas Tech – 94.74 (4) [21]
4. Florida State – 93.85 (26) [4]
5. TCU – 93.10 (5) [1]
6. North Carolina – 92.45 (2) [12]
7. Arkansas – 90.05 (16) [–]
8. Kentucky – 89.90 (6) [–]
9. LSU – 89.50 (13) [3]
10. Louisville – 85.59 (3) [7]
11. Stanford – 85.54 (10) [22]
12. Vanderbilt – 84.69 (23) [5]
13. Texas A&M – 83.14 (18) [20]
14. UCLA – 81.87 (40) [43]
15. Cal State Fullerton – 80.40 (21) [11]
16. Virginia – 78.78 (9) [16]
17. Texas – 78.58 (24) [33]
18. Clemson – 78.56 (7) [13]
19. Mississippi State – 76.80 (17) [32]
20. Mississippi – 75.93 (43) [25]
21. Southern Mississippi – 74.73 (11) [42]
22. South Alabama – 70.54 (44) [–]
23. Houston – 69.94 (31) [30]
24. North Carolina State – 69.20 (48) [14]
25. Arizona – 68.54 (14) [10]
26. South Carolina – 67.89 (30) [6]
27. Dallas Baptist – 65.82 (x) [29]
28. Miami – 65.78 (x) [19]
29. Missouri State – 63.44 (19) [–]
30. Sam Houston State – 61.89 (50) [35]
31. Long Beach State – 60.17 (15) [27]
32. UCF (Central Florida) – 60.08 (29) [–]
33. West Virginia – 59.84 (35) [–]
34. Louisiana-Lafayette – 58.82 (x) [17]
35. Indiana – 57.69 (46) [–]
36. Auburn – 56.48 (25) [–]
37. Oklahoma State – 56.42 (x) [15]
38. San Diego – 55.70 (47) [–]
39. Wake Forest – 53.88 (12) [–]
40. Oklahoma – 51.53 (27) [–]
41. Michigan 50.57 (22) [40]
42. Georgia Tech – 50.33 (x) [28]
43. St. John’s – 50.13 (28) [–]
44. Nebraska – 49.16 (33) [46]
45. BYU – 48.43 (36) [–]
46. Rice – 48.29 (x) [26]
47. Duke – 47.91 (x) [–]
48. California – 47.43 (x) [45]
48. Coastal Carolina – 47.43 (x) [9]
50. San Diego State – 47.35 (45) [–]
– next five: Winthrop, Gonzaga, Loyola Marymount, Louisiana Tech and Washington
> These NINE teams were in final 2017 regular-season CNR top-50 but not in 2018 preseason top-50:
(20) South Florida
(32) Baylor
(34) LMU
(37) Louisiana Tech
(38 Maryland
(39) Southeastern Louisiana
(41) New Mexico
(42) Old Dominion
(49) Washington
> These 15 teams were in the 2017 CNR preseason top-50 but not in 2018 preseason top-50:
East Carolina [2017 CNR preseason #18]
UC Santa Barbara [23]
Washington [24]
Maryland [31]
Arizona State [34]
Tulane [36]
UNC Wilmington [37]
Florida Atlantic [38]
Gonzaga [39]
New Mexico [41]
USC [44]
Oregon [47]
Wright State [48]
Southeastern Louisiana [49]
Cal Poly [50]
____________________
CB360 Composite Top-50 National Rankings #13 (final reg.-season; mid-May, 2017)
(rank) Team – voting pts (prev. weeks/most recent first)
1. Oregon State – 98.35 (1 … 1 … 1 … 1 … 1 … 1 … 1 … 1 … 5 … 5 … 5 … #8 preseason)
2. North Carolina – 96.47 (2 … 2 … 2 … 2 … 2 … 3 … 7 … 9 … 13 … 7 … 8 … 12)
3. Louisville – 95.58 (3 … 3 … 3 … 3 … 3 … 4 … 5 … 2 … 2 … 2 … 4 … 7)
4. Texas Tech – 93.65 (5 … 6 … 4 … 4 … 4 … 2 … 2 … 4 … 6 … 10 … 16 … 21)
5. TCU – 91.46 (7 … 7 … 6 … 5 … 7 … 8 … 14 … 5 … 1 … 1 … 1 …1)
6. Kentucky – 90.07 (4 … 5 … 8 … 9 … 8 … 12 … 19 … 43 … – … – … – … –)
7. Clemson – 88.98 (6 … 4 … 5 … 6 … 5 … 5 … 8 … 17 … 12 … 16 … 19 … 13)
8. Florida – 88.65 (10 … 12 … 10 … 13 … 18 … 12 … 23 … 28 … 14 … 16 … 4 … 2 … 2)
9. Virginia – 87.88 (8 … 8 … 12 … 8 … 17 … 21 … 16 … 11 … 7 … 9 … 10 … 16)
10. Stanford – 84.53 (11 … 17 … 36 … 24 … 33 … 25 … 25 … 22 … 15 … 17 … 22 … 22)
11. Southern Mississippi – 83.64 (15 … 19 … 16 … 16 … 16 … 22 … 20 … 42 … 49 … 35 … 44 … 42)
12. Wake Forest – 82.40 (9 … 11 … 11 … 9 … 10 … 11 … 11 … 16 … 23 … 33 … 42 … – … – … –)
13. LSU – 82.32 (12 … 13 … 11 … 13 … 18 … 13 … 10 … 8 … 8 … 3 … 3 … 3)
14. Arizona – 81.45 (18 … 9 .. 7 … 7 … 6 … 9 … 3 … 3 … 4 … 6 … 7 … 10)
15. Long Beach State – 80.65 (16 … 18 … 18 … 17 … 25 … 32 … – … – … – … – … 38 … 27)
16. Arkansas – 80.11 (17 … 10 … 10 .. 9 … 14 … 15 … 17 … 26 … 37 … 23 … 25 … 39 … –)
17. Mississippi State – 77.82 (20 … 15 … 17 … 20 … 30 … 48 … – … – … – … 39 … 34 … 32)
18. Texas A&M – 76.41 (14 … 27 … 23 … 28 … 34 … 47 … 46 … 16 … 9 … 12 … 14 … 20)
19. Missouri State – 75.11 (22 … 20 … 34 … 29 … 37 … 45 … 37 … 28 … 21 … 37 … 49 … –)
20. South Florida – 72.45 (23 … 28 … 24 … 22 … 27 … 20 … 18 … 27 … 31 … 46 … – … –)
21. Cal State Fullerton – 71.90 (24 … 22 … 15 … 10 … 14 … 15 … 4 … 13 … 17 … 15 … 13 … 11)
22. Michigan – 70.49 (19 … 14 … 14 … 23 … 20 … 29 … 24 … 19 … 30 … 43 … – … 40)
23. Vanderbilt – 68.54 (26 … 26 … 29 … 21 … 23 … 26 … 29 … 25 … 22 … 14 … 6 … 5)
24. Texas – 66.21 (21 … 35 … 37 … 34 … 43 … 38 … – … 34 … 46 … 19 … 28 … 33)
25. Auburn – 65.67 (13 … 16 … 21 … 26 … 24 … 28 … 30 … – … – … – … – … –)
26. Florida State – 65.22 (31 … 31 … 33 … 32 … 22 … 18 … 17 … 6 … 3 … 8 … 9 … 4)
27. Oklahoma – 63.82 (37 … 42 … 30 … 12 … 9 … 14 … 21 … 30 … 24 … 27 … 48 … –)
28. St. John’s – 63.07 (25 … 23 … 22 … 25 … 13 … 10 … 11 … 10 … 11 … 20 … – … –)
29. Central Florida (UCF) – 63.05 (32 … 30 … 27 … 38 … 29 … 41 … 42 … 36 … 45 … 33 … – … –)
30. South Carolina – 61.94 (30 … 29 … 26 … 15 … 10 … 6 … 6 … 18 … 18 … 13 … 11 … 6)
31. Houston – 61.91 (33 … 24 … 20 … 19 … 21 … 11 … 22 … 29 … 26 … 28 … 25 … 30)
32. Baylor – 61.70 (29 … 34 … 35 … 35 … 31 … 19 … 9 … 7 … 10 … 31 … – … –)
33. Nebraska – 58.70 (– … – … – … 43 … – … – … – … – … – … – … 42…46)
34. Loyola Marymount – 58.56 (43 … – … – … – … – … – … – … – … – … – … – … –)
35. West Virginia – 58.53 (28 … 25 … 19 … 30 … 28 … 34 … 38 … – … – … – … – … –)
36. BYU – 58.49 (34 … – … – … – … – … – … – … – … – … – … – … –)
37. Louisiana Tech – 58.32 (38 … 41 … 39 … – … – … 44 … 40 … 21 … 20 … 34 … 46 … –)
38. Maryland – 57.06 (27 … 21 … 38 … 42 … 35 … – … – … – … – … – … 45 … 31)
39. Southeastern Louisiana – 56.76 (42 … – … – … – … 39 … – … 31 … 31 … 47 … – … – … –)
40. UCLA – 56.37 (46 … 43 … – … – … – … – … – … – … – … 40 … 35 … 43)
41. New Mexico – 54.80 (40 … 39 … 42 … 39 … 26 … 30 … 35 … 24 … 28 … 49 … 32 … 41)
42. Old Dominion – 54.78 (39 … 40 … 49 … 45 … 40 … 35 … – … – … – … – … – … –)
44. Mississippi – 54.46 (35 … 44 … 41 … 44 … 48 … 27 … 15 … 20 … 19 … 11 … 12 … 25)
44. South Alabama – 53.19 (44 … – … – … – … – … – … – … – … 50 … – … 41 … –)
45. San Diego State – 51.10 (– … 46 … 43 … – … – … – … – … – … – … – … – … –)
46. Indiana – 50.92 (50 … – … – … – … – … – … – … – … – … – … – … –)
47. San Diego – 49.81 (47 … 36 … 25 … 31 … 32 … 43 … 36 … 32 … 44 … – … – … –)
48. North Carolina State – 48.16 (– … – … 47 … – … – … – … – … – … 39 … 18 … 15 … 14)
49. Washington – 47.15 (41 … 48 … 40 … 47 … – … – .. 43 … 50 … 33 … 23 … 21 … 24)
50. Sam Houston State – 46.69 (– … – … 48 … 41 … 49 … – … 47 … – … – … – … 43 … 35)
> next five: McNeese State, Mercer, Gonzaga, Binghamton & Utah
• Dropped Out of 2017 Top–50 After Week-12:
[36] McNeese State – 57.50 (36 … 32 … 28 … 33 … 36 … 40 … 48 … 49 … – … – … – … –)
[45] Florida Atlantic – 50.87 (45 … – … – … – … – … – … – … – … – … – … 31…38)
[48] Utah – 48.88 (48 … 38 … – … – … – … – … – … 41 … 38 … 45 … – … –)
[49] Charlotte – 48.77 (49 … – … – … – … – … – … – … 47 … 41 … – … – … –)
• Dropped Out of 2017 Top–50 After Week-11:
[33] Mercer – 59.39 (33 … 31 … 37 … 44 … 49 … 34 … – … – … – … – … –)
[37] Louisiana-Lafayette – 55.42 (37 … – … – … – … – … 49 … 35 … 29 … 22 … 18 … 17)
[43] UCLA – 51.44 (43 … – … – … – … – … – … – … – … 40 … 35 … 43) … now back in top–50
[45] Oklahoma State – 50.87 (45 … – … 49 … 38 … 33 … 27 … 39 … 36 … 21 … 17 … 15)
[46] San Diego State – 50.51 (46 … 43 … – … – … – … – … – … – … – … – … –) … now back in top–50
[47] Nebraska – 49.39 (47 … – … 43 … – … – … – … – … – … – … 42 … 46) … now back in top–50
[49] Gonzaga – 48.86 (49 … – … – … – … – … – … – … – … – … – … 39)
[50] Charlotte – 47.93 (50 … – … – … – … – … – … – … 47 … 41 … – … –)
• Dropped Out of 2017 Top–50 After Week-10:
[32] Oregon – 64.03 (32 … 27 … 41 … 36 … 41 … 38 … – … – … – … 47)
[44] Minnesota – 51.06 (44 … 46 … 47 … – … – … – … – … – … – … –)
[45] Missouri – 68.14 (45 … – … – … 24 … 13 … 26 … 37 … 47 … – … –)
[46] Coastal Carolina (46 … – … – … – … – … 44 … 35 … 29 … 23 … 9)
[47] North Carolina State (47 … – … – … – … – … – … 39 … 18 … 15 … 14) … now back in top–50
[48] Sam Houston State – 52.53 (48 … 41 … 49 … – … 47 … – … – … – … 43 … 35) … now back in top–50
[50] Tennessee Tech – (50 … – … – … – … – … – … – … – … – … –)
• Dropped Out of 2017 Top–50 After Week-9:
[36] Connecticut – 56.02 (36 … 46 … – … – … – … – … – … – … –)
[40] Florida Gulf Coast – 54.40 (40 … 19 … 7 … 12 … 15 … 43 … – … – … –)
[43] Nebraska – 51.54 (43 … – … – … – … – … – … – … 42…46) … has returned to current top–50
[48] Wright State – 49.57 (48 … 42 … 42 … 44 … – … – … – … 40 … 48)
[49] Okla. St. – 49.25 (49 … 38 … 33 … 27 … 39 … 36 … 21 … 17 … 15) … later returned to top–50
[50] Michigan State – 48.03 (50 … – … 31 … 33 … 40 … 32 … 42 … 47 … –)
• Dropped Out of 2017 Top–50 After Week-8:
[39] Southeastern Louisiana – 54.68 (39 … – … 31 … 31 … 47 … – … – … –) … now back in top–50
[45] Georgia Tech – 49.73 (45 … – … – … – … 34 … 30 … 24 … 28)
[50] Binghamton – 47.59 (50 … 46 … 39 … 45 … 48 … – … – … –)
• Dropped Out of 2017 Top–50 After Week-7:
[24] Missouri – 68.14 (24 … 13 … 26 … 37 … 47 … – … –) … later returned to top–50
[31] Michigan St. – 61.08 (31 … 33 … 40 … 32 … 42 … 47 … –) … later returned to top–50
[37] East Carolina – 55.75 (37 … 45 … 12 … 14 … 24 … 26 … 18)
[39] Kent State – 55.24 (39 … 50 … 46 … – … 48 … – … –)
[44] Louisiana Tech – 52.87 (44 … 40 … 21 … 20 … 34 … 46 … –) … has returned to current top–50
[50] Tennessee – 49.58 (50 … 32 … 23 … 25 … 38 … – … –)
• Dropped Out of 2017 Top–50 After Week-6:
[31] Southeastern Louisiana – 61.22 (31 … 31 … 47 … – … – … –) … now back in top–50
[43] Washington – 55.49 (43 … 50 … 33 … 23 … 21 … 24) … has returned to current top–50
[47] Sam Houston St. – 53.67 (47 … – … – … – … 43…35) … now back in top–50
[49] Louisiana-Lafayette – 52.48 (49 … 35 … 29 … 22 … 18 … 17) … later returned to top–50
• Dropped Out of 2017 Top–50 After Week-5:
[34] Texas (34 … 46 … 19 … 28 … 33) … has returned to current top–50
[41] Utah (41 … 38 … 45 … – … –) … later returned to top–50
[44] Coastal Carolina (44 … 35 … 29 … 23 … 9) … later returned to top–50
[47] Charlotte (47 … 41 … – … – … –) … later returned to top–50
[48] Dallas Baptist (48 … 27 … 26 … 29 … 29)
• Dropped Out of 2017 Top–50 After Week-4:
[34] Georgia Tech (34 … 30 … 24 … 28) … later returned to top–50
[39] North Carolina State (39 … 18 … 15 … 14) … later returned to top–50
[40] Kansas State (40 … 50 … – … –)
[50] South Alabama (50 … – … 41 … –) … now back in top–50
• Dropped Out of 2017 Top–50 After Week-3:
[32] UC Santa Barbara (32 … 30 … 23)
[36] Miami (36 … 20 … 19)
[39] Mississippi St. (39 … 34 … 32) … has returned to current top–50
[40] UCLA (40 … 35 … 43) … has returned to current top–50
[41] Virginia Tech (41 … – … –)
[44] Arizona State (44 … 37 … 34)
[48] Kent State (48 … – … –)
• Dropped Out of 2017 Top–50 After Week-2:
[27] Rice (27…#26 preseason)
[31] Florida Atlantic (31…38) … later returned to top–50
[33] UNC Wilmington (33…37)
[36] USC (36…44)
[38] Long Beach State (38…27) … has returned to current top–50
[40] Wright State (40…48) … later returned to top–50
[41] South Alabama (41…–) … now back in top–50
[42] Nebraska (42…46) … has returned to current top–50
[43] Sam Houston State (43…35) … now back in top–50
[45] Maryland (45…31) … has returned to current top–50
[50] Pepperdine (50…–)
Dropped Out of 2017 CNR Top–50 After Opening Week:
[36] Tulane
[39] Gonzaga … later returned to top–50
[40] Michigan … later returned to top–50
[45] California
[47] Oregon … later returned to top–50
[49] Southeastern Louisiana … now back in top–50
[50] Cal Poly
_____________________________
CB360 Preseason Composite Top-50 Rankings for 2017
(rank) Team – voting pts (final 2016 CNR, at end of reg. season) [2016 preseason CNR]
1. TCU – 98.96 (#11 in final 2016 top-50/end reg.-season) [#11 in 2016 preseason top-50] … 2017 CWS Participant (bracket finalist)
2. Florida – 97.63 (1) [1] … 2017 CWS Champion
3. LSU – 94.56 (10) [5] … 2017 CWS Runner-Up
4. Florida State – 92.79 (14) [13] … 2017 CWS Participant
5. Vanderbilt – 91.72 (8) [2]
6. South Carolina – 90.83 (9) [29]
7. Louisville – 90.74 (2) [4] … 2017 CWS Participant
8. Oregon State – 89.27 (41) [8] … 2017 CWS Participant (bracket finalist)
9. Coastal Carolina – 86.07 (16) [30]
10. Arizona – 85.58 (21) [X]
11. Cal State Fullerton – 85.00 (18) [16] … 2017 CWS Participant
12. North Carolina – 83.40 (23) [23]
13. Clemson – 83.16 (17) [X]
14. North Carolina State – 82.79 (13) [19]
15. Oklahoma State – 80.38 (19) [10]
16. Virginia – 80.12 (15) [7]
17. Louisiana-Lafayette – 80.01 (26) [15]
18. East Carolina – 79.55 (45) [X]
19. Miami – 78.12 (3) [6]
20. Texas A&M – 77.29 (4) [3] … 2017 CWS Participant
21. Texas Tech – 76.47 (6) [35]
22. Stanford – 75.28 (–) [X]
23. UC Santa Barbara – 73.09 (37) [45]
24. Washington – 71.95 (38) [X]
25. Mississippi – 71.16 (7) [31]
26. Rice – 70.25 (25) [21]
27. Long Beach State – 67.75 (43) [49]
28. Georgia Tech – 62.91 (24) [39]
29. Dallas Baptist – 62.44 (27) [28]
30. Houston – 62.03 (–) [17]
31. Maryland – 61.70 (–) [24]
32. Mississippi State – 60.10 (5) [22]
33. Texas – 57.05 (–) [25]
34. Arizona State – 56.62 (28) [38]
35. Sam Houston State – 54.89 (–) [X]
36. Tulane – 54.87 (20) [40]
37. UNC Wilmington – 53.22 (35) [50]
38. Florida Atlantic – 51.87 (22) [46]
39. Gonzaga – 51.35 (32) [X]
40. Michigan 50.25 (29) [27]
41. New Mexico – 50.23 (–) [X]
42. Southern Mississippi – 49.93 (12) [X]
43. UCLA – 49.65 (–) [9]
44. USC – 49.35 (–) [20]
45. California – 48.90 (36) [12]
46. Nebraska – 47.80 (50) [X]
47. Oregon – 47.32 (–) [14]
48. Wright State – 46.45 (40) [X]
49. Southeastern Louisiana (–) 45.22 (33) [X]
50. Cal Poly – 45.06 (–) [X]
– next five: Arkansas, South Alabama, Louisiana Tech, Missouri State & Oklahoma
> These teams were in final 2016 regular-season CNR top-50 but not in 2017 preseason top-50:
(30) Minnesota
(31) BYU
(34) Bryant
(39) South Alabama
(42) Kent State
(44) Louisiana Tech
(46) Duke
(47) Wake Forest
(48) Ohio State
(49) Creighton
> These teams were in the 2016 CNR preseason top-50 but not in 2017 preseason top-50:
(8) Arkansas
(26) Missouri State
(32) Kentucky
(33) Notre Dame
(34) Oklahoma
(36) Indiana
(37) College of Charleston
(41) San Diego State
(42) Illinois
(43) Missouri
(44) UC Irvine
(47) Auburn
(48) Iowa
_____________________________
(keep scrolling down for CNR archive, some preseason and final regular-season, dating back to 2010)
2016 CB360 Composite National Rankings – End of Regular Season (May 18, 2016)
(rank), team – CNR pts (prev. weeks rank … preseason)
(1) Florida – 98.71 (1 … 1 … 1 … 1 … 1 … 1 … 2 … 1 … 1 … 1 … 1 … 1 … #1 preseason)
(2) Louisville – 97.97 (2 … 4 … 2 … 3 … 3 … 3 … 5 … 8 … 3 … 5 … 4 … 3 … 4)
(3) Miami – 97.20 (3 … 3 … 4 … 2 … 2 … 2 … 8 … 9 … 10 … 12 … 10 … 5 … 6)
(4) Texas A&M – 95.03 (4 … 2 … 3 … 4 … 7 … 8 … 1 … 3 … 4 … 3 … 3 … 4 … 3)
(5) Mississippi State – 94.40 (7 … 8 … 9 … 13 … 11 … 13 … 14 … 14 … 13 … 20 … 19 … 29 … 22)
(6) Texas Tech – 92.97 (5 … 9 … 10 … 7 … 10 … 20 … 25 … 40 … 41 … 35 … 31 … 36 … 35)
(7) Mississippi – 91.16 (10 … 10 … 11 … 14 … 8 … 10 … 10 … 6 … 5 … 9 … 13 … 19 … 31)
(8) Vanderbilt – 91.00 (8 … 6 … 8 … 5 … 6 … 4 … 3 … 5 … 2 … 2 … 2 … 2 … 2)
(9) South Carolina – 90.24 (6 … 5 … 5 … 6 … 4 … 6 … 4 … 11 … 15 … 19 … 16 … 30 … 29)
(10) LSU – 89.10 (13 … 17 … 14 … 12 … 19 … 18… 17 … 13 … 11 … 10 … 9 … 6 … 5)
(11) TCU – 87.45 (9 … 12 … 7 … 8 … 9 … 5 … 7 … 4 … 7 … 7 … 6 … 10 … 11)
(12) So. Mississippi – 83.66 (15 … 15 … 15 … 22 … 16 … 24 … 24 … 27 … 29 … 43 … 37 … 41 … –)
(13) North Carolina St – 83.45 (12 … 11 … 12 … 11 … 15 … 25 … 26 … 19 … 18 … 15 … 18…20…19)
(14) Florida State – 83.13 (11 … 7 … 6 … 9 … 5 … 7 … 9 … 10 … 9 … 13 … 12 … 9 … 13)
(15) Virginia – 81.31 (19 … 18 … 29 … 42 … – … 38 … 31 … 24 … 25 … 16 … 15 … 7 … 7)
(16) Coastal Carolina – 79.73 (17 … 19 … 13 … 16 … 24 … 30 … 44 … 48 … 46 … 36 … 22…28…30)
(17) Clemson – 78.20 (23 … 34 … 32 … 26 … 20 … 16 … 19 … 12 … 14 … 21 … – … – … –)
(18) Cal St Fullerton – 77.31 (26 … 36 … 38 … 33 … 41 … 41 … – … 35 … 23 … 32 … 21 … 22 … 16)
(19) Oklahoma St – 77.03 (14 … 14 … 19 … 30 … 40 … 19 … 16 … 21 … 26 … 30 … 30 … 24 … 10)
(20) Tulane – 75.71 (18 … 27 … 24 … 50 … 33 … 34 … 32 … 42 … 44 … 39 … 35 … 34 … 40)
(21) Arizona – 73.29 (16 … 30 … 18 … 44 … 49 … 39 … 23 … 29 … 27 … 48 … – … 42 … –)
(22) Florida Atlantic – 72.27 (27 … 25 … 27 … 18 … 22 … 14 … 20 … 22 … 19 … 23 … 23 … 25 … 46)
(23) North Carolina – 71.82 (24 … 20 … 15 … 15 … 12 … 9 … 6 … 2 … 6 … 6 … 7 … 15 … 23)
(24) Georgia Tech – 70.71 (22 … 22 … 35 … 32 … 26 … 22 … 15 … 23 … 31 … 17 … 20 … 23 … 39)
(25) Rice – 69.96 (20 … 23 … 20 … 20 … 27 … 32 … 40 … – … – … – … 49 … 27 … 21)
(26) Louisiana-Lafayette – 67.11 (34 … 29 … 22 … 23 … 30 … 36 … – … 49 … 35 … 27 …28…11…15)
(27) Dallas Baptist – 64.40 (37 … 41 … 36 … 45 … – … – … – … 34 … 40 … 28 … 42 … 26 … 28)
(28) Arizona State – 63.94 (42 … 42 … – … – … – … – … – … – … 32 … – … – … 44 … 38)
(29) Michigan – 62.90 (21 … 26 … 21 … 25 … 39 … 21 … 22 … 30 … 30 … 25 … 26 … 18 … 27)
(30) Minnesota – 62.59 (35 … 21 … 25 … 31 … 42 … – … – … – … – … – … – … – … –)
(31) BYU – 62.21 (39 … 28 … 28 … 21 … 21 … 17 … 18 … 17 … 16 … 41 … 40 … – … –)
(32) Gonzaga – 62.17 (45 … 45 … 47 … 39 … 34 … 44 … – … – … – … – … – … – … –)
(33) Southeastern Louisiana – 61.70 (30 … 39 … 41 … 38 … 36 … 42 … 41 … 44 … 50 …–…–…–…–)
(34) Bryant – 61.40 (36 … 35 … 33 … 43 … 50 … 48 … 50 … – … – … – … – … – … –)
(35) UNC Wilmington– 61.03 (28 … 33 … 31 … 28 … 45 … – … – … 45 … 34 … 39 … 48 … 50)
(36) California – 60.60 (41 … 37 … 30 … 17 … 17 … 12 … 11 … 16 … 12 … 11 … 14 … 17 … 12)
(37) UC Santa Barbara – 60.50 (29 … 13 … 16 … 10 … 13 … 11 … 12 … 18 … 24…29…34…38…45)
(38) Washington – 59.70 (25 … 31 … 40 … – … – … – … – … – … – … – … – … – … –)
(39) South Alabama – 57.88 (32 … 32 … 26 … 27 … 18 … 23 … 35 … 37 … 43 … 45 … 38 … 46 … –)
(40) Wright State – 55.75 (43 … – … – … – … – … – … – … – … – … – … – … – … –)
(41) Oregon State – 55.69 (31 … 16 … 17 … 19 … 14 … 15 … 13 … 7 … 8 … 4 … 5 … 12 … 8)
(42) Kent State – 54.62 (44 … – … – … – … – … – … – … 46 … – … – … – … – … –)
(43) Long Beach State – 53.82 (49 … 43 … x … 46 … 43 … 37 … 27 … 33 … 38 … 40 … 48 … – … 49)
(44) Louisiana Tech – 53.15 (– … – … – … – … – … – … – … – … – … – … – … – … –)
(45) East Carolina – 53.14 (38 … 40 … 37 … 34 … 35 … 29 … 38 … 43 … 36 … 26 … 24 … 49 … –)
(46) Duke – 52.19 (– … – … – … – … – … – … – … – … – … – … – … – … –)
(47) Wake Forest – 51.84 (47 … 47 … – … – … – … – … – … – … – … – … – … – … –)
(48) Ohio State – 51.27 (– … – … – … – … – … – … – … – … – … – … – … – … –)
(49) Creighton – 49.87 (33 … 24 … 34 … 40 … 37 … 46 … – … – … – … – … – … – … –)
(50) Nebraska – 49.48 (– … – … – … – … – … – … 43 … – … – … – … – … – … –)
Next Five – Stanford, Michigan State, Alabama, Southeast Missouri State and Kentucky
> Dropped Out of 2016 CNR Top–50 After Week–13:
(40) Michigan State (38 … 45 … 29 … 25 … 28 … 21 … 25 … 17 … 38 … 45 … – … –)
(46) Kentucky (48 … 39 … 24 … 23 … 26 … 33 … 38 … 49 … – … – … 40 … 32)
(48) Stanford (49 … x … 41 … 31 … 33 … 37 …. 32 … 34 … 37 … 29 … 33 … –)
(50) UNC Greensboro (46 … – … – … – … – … – … – … – … – … – … – … –)
> Dropped Out of CNR 2016 Top–50 After Week–12:
(44) Southeast Missouri State – 50.45 (42 … 49 … – … – … – … – … – … – … – … – … –)
(46) Lamar – 52.60 (43 … 47 … 32 … 45 … – … – … – … – … – … – … –)
(50) New Mexico – 56.84 (44 … 35 … 38 … 49 … – … – … – … 50 … 41 … – … –)
> Dropped Out of CNR 2016 Top–50 After Week–11:
(49) Missouri State (36 … 28 … 31 … 28 … 15 … 22 … 22 … 25 … 21 … 26)
(50) Cal Poly (– … – … – … – … – … – … – … 47 … – … –)
> Dropped Out of CNR 2016 Top–50 After Week–10:
(37) St. Mary’s – 56.17 (47 … – … – … – … – … – … – … – … –)
(46) Long Beach State (43 … 37 … 27 … 33 … 38 … 40 … 48 … – … 49) (has returned to current top–50)
(48) Notre Dame (– … – … – … – … – … – … – … – … –)
> Dropped Out of CNR 2016 Top–50 After Week–9:
(29) College of Charleston – 63.72 (27 … 30 … 41 … 33 … 44 … 44 … 37 … 37)
(44) Old Dominion – 52.66 (50 … 47 … 50 … – … – … – … – … –)
(46) Tennessee – 51.94 (47 … 42 … 39 … 37 … 46 … – … – … –)
(48) Houston – 51.40 ( 40 … 29 … 28 … 39 … 31 … 27 … 13 … 17)
> Dropped Out of CNR 2016 Top–50 After Week–8:
(35) Nebraska – 56.62 (43 … – … – … – … – … – … –)
(38) Virginia – 55.77 (31 … 24 … 25 … 16 … 15 … 7 … 7) (has returned to current top–50)
(43) Fresno State – 54.84 (– … – … – … 33 … 43 … – … –)
> Dropped Out of CNR 2016 Top–50 After Week–7:
(34) Arkansas – 61.90 (26 … 20 … 14 … 11 … 14 … 18)
(36) UCLA – 61.33 (20 … 28 … 18 … 17 … 16 … 9)
(39) Alabama – 53.93 (36 … 47 … 24 … 32 … 43 … –)
(45) UNC Wilmington– 52.26 (– … 45 … 34 … 39 … 48 … 50) (has returned to current top–50)
(46) Cal State Northridge – 50.46 (47 … 48 … – … – … – … –)
(48) USC – 48.99 (45 … – … – 33 … 31 … 20)
(49) Texas – 48.76 (– … 49 … 36 … 32 … 25)
> Dropped Out of CNR 2016 Top–50 After Week–6:
(31) Oregon – 71.22 (21 … 8 … 8 … 8 … 14)
(34) Dallas Baptist – 55.06 (40 … 28 … 42 … 26 … 28) (has returned to current top–50)
(35) Cal State Fullerton – 69.04 (23 … 32 … 21 … 22 … 16) (has returned to current top–50)
(49) Louisiana-Lafayette – 57.02 (35 … 27 … 28 … 11 … 15) (has returned to current top–50)
(46) Kent State – 49.33 (– … – … – … – … –) (has returned to current top–50)
> Dropped Out of CNR 2016 Top–50 After Week–5:
(32) Arizona State – 61.92 (– … – … 44 … 38) (has returned to current top–50)
(42) Boston College – 54.29 (– … – … – … –)
(45) UNC Wilmington – 48.71 (34 … 39 … 48 … 50) (has returned to current top–50)
> Dropped Out of CNR 2016 Top–50 After Week–4:
(33) Fresno State – 59.77 (43 … – … –)
(42) Cal Poly – 53.91 (47 … – … –)
(47) Missouri – 51.11 (46 … 50 … 43)
(49) Texas – 48.04 (36 … 32 … 25)
(50) New Mexico – 46.70 (41 … – … –)
> Dropped Out of CNR 2016 Top–50 After Week–3:
(33) USC – 57.60 (31 … 20)
(49) Rice – 49.30 (27 … 21) (has returned to current top–50)
(50) Oklahoma – 47.97 (45 … 34)
> Dropped Out of CNR 2016 Top–50 After Week–2:
(35) Maryland
(39) Indiana
(40) Kentucky
(42) Arizona (has returned to current top–50)
(44) Arizona State (has returned to current top–50)
(47) Notre Dame
> Dropped Out of Top–50 2016 After Week–1:
(41) San Diego State
(42) Illinois
(44) UC Irvine
(47) Auburn
(48) Iowa
(49) Long Beach State (has returned to current top–50)
_____________________________
> CB360 Preseason Composite Top-50 Rankings for 2016
(rank) Team – voting pts (final 2015 CNR, at end of reg. season) [2015 preseason CNR]
1. Florida – 99.64 (#8 in final 2015 top-50/end reg.-season) [#4 in 2015 pre. top-50] … 2016 CWS participant
2. Vanderbilt – 97.09 (11) … [1]
3. Texas A&M – 94.81 (5) [33]
4. Louisville – 94.58 (6) [10]
5. LSU – 94.44 (1) [5]
6. Miami – 93.34 (7) [18] … 2016 CWS participant
7. Virginia – 92.55 (34) [2]
8. Oregon State – 91.42 (21) [31]
9. UCLA – 91.11 (2) [6]
10. Oklahoma State – 87.95 (13) [7] … 2016 CWS Semifinalist (bracket final)
11. TCU – 87.83 (3) [3] … 2016 CWS Semifinalist (bracket final)
12. California – 86.51 (26) [–]
13. Florida State – 84.84 (12) [13]
14. Oregon – 83.04 (–) [21]
15. Louisiana-Lafayette – 82.46 (–) [44]
16. Cal State Fullerton – 82.09 (28) [16]
17. Houston – 79.97 (16) [8]
18. Arkansas – 78.15 (25) [36]
19. North Carolina State – 76.12 (41) [–]
2o. USC – 75.60 (17) [–]
21. Rice – 75.07 (19) [14]
22. Mississippi State – 73.82 (–) [19]
23. North Carolina – 72.02 (31) [12]
24. Maryland – 70.14 (36) [20]
25. Texas – 69.00 (–) [9]
26. Missouri State – 67.86 (10) [–]
27. Michigan 66.99 (–) [–]
28. Dallas Baptist – 66.41 (9) [50]
29. South Carolina – 66.18 (–) [11]
30. Coastal Carolina – 65.61 (27) [–] … 2016 CWS Champion
31. Mississippi – 64.87 (39) [24]
32. Kentucky – 62.63 (–) [49]
33. Notre Dame – 62.55 (29) [–]
34. Oklahoma – 59.74 (–) [–]
35. Texas Tech (21) – 59.45 (–) [17] … 2016 CWS participant
36. Indiana – 58.52 (–) [–]
37. College of Charleston – 58.02 (15) [34]
38. Arizona State – 57.22 (22) [15]
39. Georgia Tech – 57.15 (38) [39]
40. Tulane – 56.42 (47) [–]
41. San Diego State – 54.47 (–) [–]
42. Illinois – 52.18 (4) [37]
43. Missouri – 51.64 (49) [–]
44. UC Irvine – 51.57 (35) [41]
45. UC Santa Barbara – 51.15 (14) [25] … 2016 CWS participant
46. Florida Atlantic – 49.70 (20) [–]
47. Auburn – 49.46 (37) [–]
48. Iowa – 48.75 (18) [–]
49. Long Beach State – 47.39 (–) [–]
50. UNC Wilmington – 46.60 (–) [–]
Note: 2016 CWS runner-up Arizona was not in CNR preseason top-50
next five: Pepperdine, San Diego, Southeastern Louisiana, Alabama & Winthrop
_____________________________
• CB360 Composite Top-50 Rankings – Final 2015 Regular-Season
(12 of these teams, noted below, did not make the 2015 NCAAs)
> CLICK HERE for full release page (2015 final regular-season CNR)
1. LSU
2. UCLA
3. TCU
4. Illinois
5. Texas A&M
6. Louisville
7. Miami
8. Florida
9. Dallas Baptist
10. Missouri State
11. Vanderbilt
12. Florida State
13. Oklahoma State
14. UC Santa Barbara
15. College of Charleston
16. Houston
17. USC
18. Iowa
19. Rice
20. Florida Atlantic
21. Oregon State
22. Arizona State
23. Nevada – did not make 2015 NCAAs
24. Radford
25. Arkansas
26. California
27. Coastal Carolina
28. Cal State Fullerton
29. Notre Dame
30. Oral Roberts
31. North Carolina – did not make 2015 NCAAs
32. North Florida – did not make 2015 NCAAs
33. Ohio State – did not make 2015 NCAAs
34. Virginia
35. UC Irvine – did not make 2015 NCAAs
36. Maryland
37. Auburn
38. Georgia Tech – did not make 2015 NCAAs
39. Mississippi
40. Bradley
41. North Carolina State
42. Southeastern Louisiana – did not make 2015 NCAAs
43. Michigan State – did not make 2015 NCAAs
44. East Carolina
45. Southern Mississippi – did not make 2015 NCAAs
46. South Florida
47. Tulane
48. Nebraska – did not make 2015 NCAAs
49. South Alabama – did not make 2015 NCAAs
49. Missouri – did not make 2015 NCAAs
Next Five: UNC Wilmington, Liberty, Indiana, Alabama and St. John’s
__________________
CB360 Preseason Composite Top-50 Rankings for 2015
(rank) Team – voting pts (final 2014 CNR, at end of reg. season) [2014 preseason CNR]
1. Vanderbilt – 99.11 (#14 in final ’14 top-50) [#10 in ’14 preseason top-50] … 2015 CWS Runner-Up
2. Virginia – 97.11 (1) [3] … 2015 CWS Champion
3. TCU – 96.50 (9) [22] … 2015 CWS Semifinalist (bracket final)
4. Florida – 94.53 (5) [19] … 2015 CWS Semifinalist (bracket final)
5. LSU – 93.48 (16) [6] … 2015 CWS Participant
6. UCLA – 92.53 (–) [11]
7. Oklahoma State – 91.66 (18) [20]
8. Houston – 91.65 (15) [t50]
9. Texas – 90.68 (19) [23]
10. Louisville – 89.13 (7) [14]
11. South Carolina – 87.91 (17) [12]
12. North Carolina – 85.21 (–) [13]
13. Florida State – 83.23 (4) [5]
14. Rice – 82.99 (12) [15]
15. Arizona State – 81.22 (46) [21]
16. Cal State Fullerton – 80.96 (–) [1] … 2015 CWS Participant
17. Texas Tech (21) – 80.17
18. Miami – 79.63 (13) [17] … 2015 CWS Participant
19. Mississippi State – 76.13 (27) [4]
20. Maryland – 75.90 (–)
21. Oregon – 75.77 (20) [9]
22. Stanford – 70.90 (49) [42]
23. Kennesaw State – 67.91 (–)
24. Mississippi – 66.58 (10) [32]
25. UC Santa Barbara – 66.28 (44) [37]
26. Nebraska – 65.66 (34) [39]
27. Clemson – 63.95 (35) [16]
28. Cal Poly – 63.73 (6) [27]
29. Liberty – 61.53 (23) [45]
30. Tennessee – 61.30 (47)
31. Oregon State – 61.03 (2) [2]
32. Loyola Marymount – 60.44 (–)
33. Texas A&M – 60.20 (30) [25]
34. College of Charleston – 59.97 (–)
35. Alabama – 58.48 (24) [26]
36. Arkansas – 56.66 (50) [30] … 2015 CWS Participant
37. Illinois – 53.84 (–)
38. Central Florida (UCF) – 52.86 (38)
39. Georgia Tech – 50.77 (43) [35]
40. St. John’s – 50.32 (–)
41. UC Irvine – 50.30 (22)
42. Kent State – 47.92 (–)
43. Wichita State – 47.65 (–) [41]
44. Louisiana-Lafayette – 47.43 (3) [24]
45. Pepperdine – 47.06 (25)
46. Ball State – 46.34 (–)
47. Sam Houston State – 45.14 (36) [46]
48. San Diego – 44.29 (37) [33]
49. Kentucky – 43.67 (29) [44]
50. Dallas Baptist – 43.36 (39)
– next five: Oklahoma, Indiana, New Mexico, USC and Ohio State.
_____________________________
• CB360 Composite Top-50 Rankings – Final 2014 Regular-Season
(all but eight teams, noted below, made the 2014 NCAAs)
(1) Virginia
(2) Oregon State
(3) Louisiana (Lafayette)
(4) Florida State
(5) Florida
(6) Cal Poly
(7) Louisville
(8) Indiana
(9) TCU
(10) Mississippi
(11) Washington
(12) Rice
(13) Miami
(14) Vanderbilt
(15) Houston
(16) LSU
(17) South Carolina
(18) Oklahoma State
(19) Texas
(20) Oregon
(21) Texas Tech
(22) UC Irvine
(23) Liberty
(24) Alabama
(25) Pepperdine
(26) Mercer – did not make 2014 NCAAs
(27) Mississippi State
(28) Indiana State
(29) Kentucky
(30) Texas A&M
(31) West Virginia – did not make 2014 NCAAs
(32) Florida International – did not make 2014 NCAAs
(33) UNLV
(34) Nebraska
(35) Clemson
(36) Sam Houston State
(37) San Diego – did not make 2014 NCAAs
(38) Central Florida (UCF) – did not make 2014 NCAAs
(39) Dallas Baptist
(40) Kansas
(41) Bryant
(42) New Mexico – did not make 2014 NCAAs
(43) Georgia Tech
(44) UC Santa Barbara – did not make 2014 NCAAs
(45) San Diego State
(46) Arizona State
(47) Tennessee – did not make 2014 NCAAs
(48) Old Dominion
(49) Stanford
(50) Arkansas
• CB360 Preseason Composite Top-50 Rankings for 2014
(rank) Team – voting pts (final 2014 CNR, at end of reg. season)
1. Cal State Fullerton – 98.92 (4)
2. Oregon State – 97.54 (6)
3. Virginia – 96.03 (5) … 2014 CWS Runner-Up
4. Mississippi State – 95.75 (12)
5. Florida State – 95.48 (7)
6. LSU – 94.24 (3)
7. Indiana – 93.82 (13)
8. North Carolina State – 92.10 (8)
9. Oregon – 91.60 (9)
10. Vanderbilt – 90.88 (2) … 2014 CWS Champion
11. UCLA – 89.59 (10)
12. South Carolina – 89.54 (11)
13. North Carolina – 87.16 (1)
14. Louisville – 86.14 (14) … 2014 CWS Participant
15. Rice – 84.10 (22)
16. Clemson – 83.91 (16)
17. Miami – 83.28 (25)
18. Kansas State – 81.54 (21)
19. Florida – 80.82 (34)
20. Oklahoma State – 78.50 (31)
21. Arizona State – 78.30 (15)
22. TCU – 77.71 (–) … 2014 CWS Participant
23. Texas – 77.70 (–) … 2014 CWS Participant
24. Louisiana-Lafayette – 77.59 (32)
25. Texas A&M – 76.27 (–)
26. Alabama – 73.90 (39)
27. Cal Poly – 71.34 (28)
28. Arizona – 67.06 (–)
29. East Carolina – 67.02 (–)
30. Arkansas – 65.09 (20)
31. Florida Atlantic – 64.44 (–)
32. Mississippi – 61.37 (18) … 2014 CWS Participant
33. San Diego – 59.86 (–)
34. Oklahoma – 57.87 (27)
35. Georgia Tech – 57.52 (26)
36. UNC Wilmington – 57.46 (33)
37. UC Santa Barbara – 55.70 (–)
38. Western Carolina – 55.50 (–)
39. Nebraska – 55.13 (–)
40. New Mexico – 54.00 (35)
41. Wichita State –53.24 (–)
42. Stanford – 53.02 (38)
43. Coastal Carolina – 52.86 (40)
44. Kentucky – 51.80 (36)
45. Liberty – 50.31 (–)
46. Mercer –49.70 (24)
46. Sam Houston State – 49.70 (–)
46. UNLV – 49.70 (–)
46. Washington State – 49.70 (–)
50. Houston – 48.20 (–)
50. North Florida – 48.20 (49)
note: 2014 CWS participants Texas Tech and UC Irvine were not in 2014 preseason CNR top-50
_____________________________
• CB360 Preseason Composite Top-50 Rankings for 2013
1-Arkansas
2-North Carolina … 2013 CWS Participant
3-Vanderbilt
4-LSU … 2013 CWS Participant
5-UCLA … 2013 CWS Champion
6-Stanford
7-South Carolina
8-Oregon
9-Oregon State … 2013 CWS Participant
10-North Carolina State … 2013 CWS Participant
11-Kentucky
12-TCU
13-Mississippi State … 2013 CWS Runner-Up
14-Florida
15-Florida State
16-Louisville … 2013 CWS Participant
17-Oklahoma
18-Georgia Tech
19-Arizona
20-San Diego
21-Rice
22-Mississippi
23-Cal State Fullerton
24-Texas
25-Texas A&M
26-Miami
27-Arizona State
28-Clemson
29-Virginia
30-UC Irvine
31-Baylor
32-New Mexico
33-Southern Mississippi
34-Coastal Carolina
35-Missouri State
36-Kent State
37-Wichita State
38-East Carolina
39-Dallas Baptist
40-Tulane
41-Sam Houston State
42-Georgia
43-Florida Atlantic
44-St. John’s
45-Pepperdine
46-Virginia Tech
47-College of Charleston
48-Auburn
49-Elon
50-Notre Dame
Note: 2013 CWS participant Indiana was not in the CNR preseason top-50
_____________________________
• CB360 Preseason Composite Top-50 Rankings for 2012
(rank) Team – voting pts
1. Florida … 99.86 … 2012 CWS Participant
2. South Carolina … 98.41 … 2012 CWS Runner-Up
3. Stanford … 97.42
4. North Carolina … 95.27
5. Texas A&M … 94.83
6. Rice … 94.26
7. Texas … 92.64
8. Arkansas … 92.45 … 2012 CWS Participant
9. Georgia Tech … 90.71
10. LSU … 88.95
11. Vanderbilt … 87.57
12. Florida State … 86.87 … 2012 CWS Participant
13. TCU … 85.95
14. Arizona … 85.73 … 2012 CWS Champion
15. Miami … 84.33
16. UCLA … 81.79 … 2012 CWS Participant
17. Oklahoma … 81.01
18. Clemson … 79.79
19. Cal State Fullerton … 79.56
20. Georgia … 79.13
21. Arizona State … 76.93
22. California … 76.26
23. Virginia … 74.74
24. St. John’s … 74.10
25. UC Irvine … 74.02
26. Stetson … 73.72
27. Oregon State … 72.20
28. Louisville … 71.38
29. Baylor … 65.18
30. Central Florida … 62.93
31. East Carolina … 59.58
32. Mississippi State … 59.10
33. Mississippi … 58.35
34. Southern Mississippi … 57.80
35. Georgia Southern … 57.55
36. College of Charleston … 57.18
37. Dallas Baptist … 54.90
38. Florida International … 53.64
39. Jacksonville … 52.58
40. Oregon … 52.30
41. Coastal Carolina … 52.10
42. Missouri State … 51.48
43. Wichita State … 49.43
44. Troy … 49.24
45. Oklahoma State … 49.02
46. North Carolina State … 48.94
47. Texas State … 48.68
48. Purdue … 48.12
49. Fresno State … 46.71
50. USC … 46.60
Note: 2012 CWS participants Kent State and Stony Brook were not in CNR preseason top-50
_____________________________
• CB360 Preseason Composite Top-50 Rankings for 2011
1. UCLA
2. Florida … 2011 CWS Runner-Up
3. TCU
4. Vanderbilt … 2011 CWS Participant
5. Oklahoma
6. Texas … 2011 CWS Participant
7. Clemson
8. Cal State Fullerton
9. South Carolina … 2011 CWS Champion
10. Arizona State
11. Oregon
12. Florida State
13. Stanford
14. Texas A&M … 2011 CWS Participant
15. Virginia … 2011 CWS Participant
16. Connecticut
17. Rice
18. Arizona
19. LSU
20. Miami
21. Coastal Carolina
22. Auburn
23.Georgia Tech
24. California … 2011 CWS Participant
25. Baylor
26. College of Charleston
27. Louisville
28. UC Irvine
29. Arkansas
30. North Carolina … 2011 CWS Participant
31. St. John’s
32. Fresno State
33. Wichita State
34. Washington State
35. Florida Atlantic
36. San Diego
37. Alabama
38. Tulane
39. Pittsburgh
40. Kansas State
41. Hawaii
42. Kent State
43. Mississippi
44. Oregon State
45. Virginia Tech
46. Southern Mississippi
47. Central Florida
48. Liberty
48. Minnesota
48. North Carolina State
_____________________________
2010 Preseason College Baseball 2010 Composite National Rankings (CNR)
courtesy of CollegeBaseball360.com (#1; Feb. 19, 2010)
1. Texas – 98.50
2. LSU – 96.11
3. Cal State Fullerton – 95.14
4. Virginia – 94.04
5. UC Irvine – 89.68
6. Rice – 89.33
7. Florida State – 88.89 – CWS participant
8. Georgia Tech – 88.17
9. Florida – 87.94 – CWS participant
10. Arizona State – 87.66 – CWS participant
11. TCU – 80.50 – CWS semifinalist (bracket finalist)
12. Clemson – 80.16 – CWS participant
13. North Carolina – 79.57
14. Miami (FL) – 79.34
15. Arkansas – 78.17
16. Oregon State – 77.90
17. East Carolina – 76.51
18. Coastal Carolina – 76.43
19. Louisville – 76.05
20. South Carolina – 72.92 – CWS champion
21. San Diego – 72.83
22. Mississippi – 72.68
23. Georgia – 68.34
24. Ohio State – 63.79
25. UCLA – 63.43 – CWS runner-up
26. Southern Mississippi – 61.94
27. Kansas – 56.78
28. Oklahoma – 54.04 – CWS semifinalist (bracket finalist)
29. Stanford – 53.75
30. Texas A&M – 52.96
31. Vanderbilt – 50.75
32. Wichita State – 49.83
33. Minnesota – 48.92
34. Alabama – 44.37
35. Pepperdine – 44.36
36. Kansas State – 42.79
37. Long Beach State – 39.54
38. Kentucky – 38.79
39. Missouri – 38.73
40. Cal Poly – 38.02
41. Arizona – 37.97
42. Oklahoma State – 37.88
43. Nebraska – 37.44
44. Oral Roberts – 37.27
44. Gonzaga – 37.27
46. Middle Tennessee – 37.20
47. Fresno State – 37.14
48. Florida Gulf Coast – 37.08
Boston College – 37.08
50. Jacksonville – 37.02